STAY INFORMED AND UP TO DATE WITH THE LATEST DRAYAGE NEWS

Back to Resources

Apr 18, 2024

Stay Informed and Up-to-Date with the Latest Drayage News

News

Welcome to our Drayage News Updates blog, your go-to source for weekly bullet points on the latest events in the dynamic world of drayage shipping. Get the latest news and industry updates for drayage, container shipping and imports for the U.S. Stay informed about current happenings and gain valuable insights into the industry’s trends, regulations, and innovations. Our concise and straightforward summaries will keep you up to date with the ever-changing landscape of container shipping, making us your trusted destination for all things Drayage.

April 15th: Port of Oakland Closes Amid Pro-Palestinian Protests 

  • On Monday, 4/15, the Port of Oakland’s four container terminals closed for the day shift as a precaution due to pro-Palestinian protests in the area. The port reopened in the afternoon. 
  • Pro-Palestinian demonstrators also targeted the Port of New York and New Jersey, particularly focusing on Zim Integrated Shipping Services. The port remained open. (JOC

April 8th: FMCSA Waiver Provides Relief for Baltimore Drayage Companies Amid Port Closure 

  • Drayage transportation companies face the dilemma of relocating resources or hiring temporary help amidst the Baltimore port closure, as most dray drivers are used to going home each night. 
  • A recent FMCSA waiver granting two extra hours of service time could enable Baltimore-based drayage drivers to serve Norfolk while still being home at night. (Freight Waves

April 1st: Port of Baltimore Closure Spurs Increased Costs and Challenges in Drayage Operations 

  • The closure of the Port of Baltimore is causing challenges in drayage operations, leading to increased trucking and warehousing costs as importers scramble to adjust distribution strategies. 
  • Shippers are facing the need to reconnect Baltimore-bound freight with alternative distribution channels, potentially involving longer drayage distances and additional warehousing needs.
  • The diversion of freight among ports is prompting the need for new distribution centers and more drayage drivers, resulting in increased complexities and costs in the transportation network. (JOC

March 25th: What you should know about the Port of Baltimore

  • The Port of Baltimore is the busiest US port for car shipments and the largest by volume for handling farm & construction machinery, as well as agricultural products. Other top imports are paper and plywood. 
  • It is also the second busiest US port for coal exports. Other key commodities exported from the port are LNG, wastepaper, ferrous scrap and light trucks. 
  • The port handles nearly $800bn in cargo and services nearly 1,800 vessels yearly according to Maryland State Archives. 

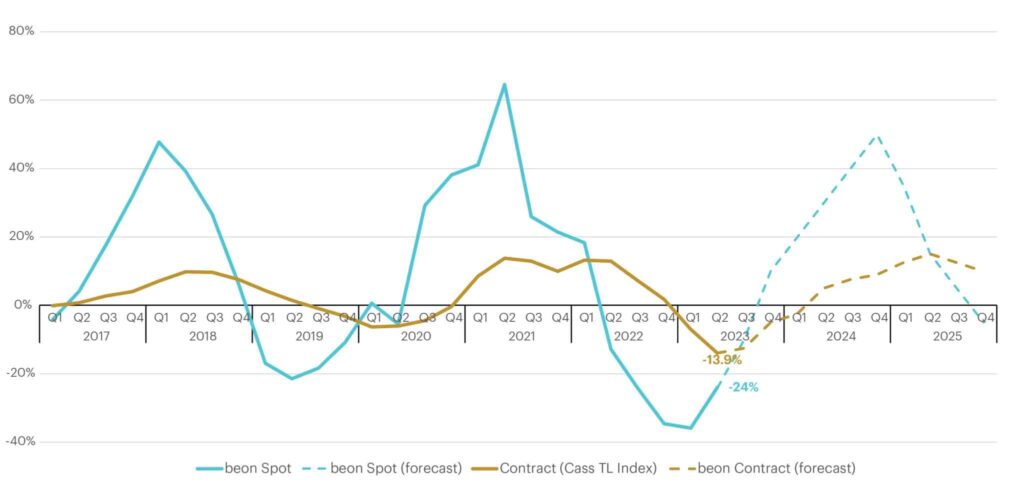
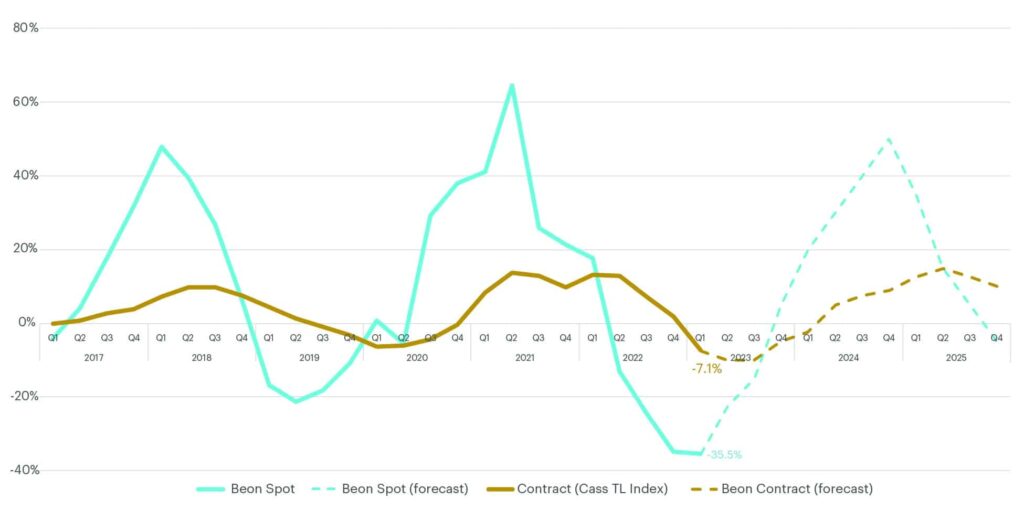
March 18th: Container Spot Rates Dip After Lunar New Year Celebrations Despite Market Strength

  • Container spot rates from Asia to the United States are experiencing a seasonal dip post-Lunar New Year celebrations, despite market strength, attributed to increased carrier capacity and slow negotiations by major US retailers on annual service contracts.   
  • While container spot rates have dropped significantly, they remain higher than the previous year’s lows, suggesting a resilient market. Platts reports Asia-US rates of $3,000 per FEU to the West Coast and $4,500 to the East Coast, down from recent highs but not reaching last year’s levels, which sunk down to $1,050 and $2,050 for the West and East coast respectively. 
  • US retailers anticipate growth in imports from Asia, leading to increased projections for the second quarter and beyond, signaling positive signs for market expansion.  (JOC

March 11th: YoY February Imports Up 22.9%, Boosting Freight Demand

  • While February imports are down 6% from January (normal seasonality), it’s important to note that YoY February imports are up 22.9%, which is a good sign for freight demand. While other factors are headwinds for freight, imports are providing a solid tailwind for the industry. 

March 5th: Red Sea Disruptions Impact Ocean Carrier On-Time Reliability in January

  • In January, ocean carrier on-time reliability decreased in January as a result of the disruptions in the Red Sea to 51.6%. This indicator is typically in the 70-80% range. (JOC)
  • However, February experienced a bit of a rebound, at least in terms of shorter delays. The average delay for a ship from Asia to the East Coast, dropped from 11 days down to 8.5 days. 

February 26th: Delay and Cost Increase in Cargo Shipments Due to Red Sea Attacks 

  • The attacks on merchant vessels in the Red Sea have led to delays in cargo shipments and increased shipping costs. However, the impact on inflation is expected to be muted due to soft demand and ample availability of ships. 
  • According to Alan Murphy, CEO of Sea-Intelligence Maritime Intelligence, “The present situation therefore does not present any reason to believe we will see a resumption of the Suez-routing anytime soon from the global carriers…Consequently, shippers should clearly plan for round- Africa as the new normal.” (JOC)  

February 21st: Backlog at Oakland Terminal to be cleared in 2 weeks with added shift 

  • As reported by the JOC: A backlog of nine vessels at Oakland International Container Terminal (OICT), should be cleared within two weeks as OICT has temporarily added a third shift each day to reduce congestion at the facility. (JOC)

February 5th: Shipping Costs Surge as Container Spot Rates Reach New Heights

  • Elevated container spot rates that have been increasing dramatically since the start of the new year.
  • As of January 29th, spot rates from Asia to the West Coast are $4,421 or up 115% over this same time last year.
  • East Coast spot rates from Asia are $6,165 or up 90.9% year over year.

January 29th: Shippers Advised To Plan Wisely to Tackle Rate Hike Challenges

  • Importers, especially those constrained by contractual restrictions on surcharges, may face challenges in absorbing additional rate hikes.
  • To navigate these issues, shippers are advised to understand their supply chain needs, utilize data for inventory planning, consider splitting shipments, collaborate with trusted logistics partners, explore different shipping modes and ports, diversify container types, and budget for potential delays during this critical period.

January 23th: Import Volume from Asia to US Set to Decline During Lunar New Year Period

  • We spoke above about some of the impacts of Lunar New Year on imports from Asia to the US.
  • Looking back to 2018 and the subsequent years, every year, less the COVID era, accounted for a 19-38% drop in import volume (TEUs) from Asia to the US from January to March.
  • This year’s decline in import volume is expected to be more in-line with 2018-2019 levels.

January 15th: Descartes Reveals 2023 Imports Surpass Pre-COVID Years, With a 4.6% Increase Over 2019

  • According to Descartes, 2023’s full-year imports came in at 24,959,664 TEUs. Compared to pre-COVID years, 2023 topped 2019 by 4.6%, 2018 by 3.8% and 2017 by 11.5%.
  • Imports ended the year strong on the Gulf and East Coasts with jumps of 29.5% (Houston), 5.1% (NY/NJ), 6.3% (Charleston), 2.6% (Savannah), and 11.3% (Baltimore) from November into December.
  • Numbers on the West Coast dropped month over month with Long Beach down 8.5%, LA down 5.3% and Tacoma down 26%.

January 8th: Freight Surge Expected at LA-Long Beach Ports Amidst Panama Canal and Suez Canal Threats

  • Increased freight is expected at Los Angeles-Long Beach Ports given drought headwinds at the Panama Canal. This being paired with the Suez Canal/Red Sea shipping threats are sure to raise shipping prices from Asia to North America. The Shanghai – LA spot rate has already jumped 30% since December 21st. (FreightWaves)
  • There are looming threats of a potential strike on the East Coast from the International Longshoremen’s Association (ILA). The ILA is seeking higher wages and pushing back against automation. The current contract is set to expire in October 2024.

December 18th: US Retailer Express Optimism for Import Forecasts for Early 2024 After Strong Holiday Sales

  • In November, the West Coast’s market share of imports from Asia increased by five percentage points, reaching 58.6%. Ongoing challenges in the Panama and Suez canals, including missile attacks, may further drive cargo to the West Coast. (JOC)
  • The full impact of canal disruptions is yet to be experienced, and diversions to the West Coast may become more discernible in January.
  • US retailers are optimistic about early 2024, increasing import forecasts due to strong end-of-year holiday sales. December imports are expected to jump 11.5% over December 2022, with January imports projected to climb 6.6% year over year. (JOC)

December 11th: Port of Los Angeles Aims to Enhance Efficiency with New 80-Acre Near-Dock Storage and Maintenance Site

  • The Port of Los Angeles intends to improve fluidity at its six container terminals by developing an 80-acre near-dock site that will be used for container storage and chassis maintenance and repair. (JOC)

December 4th: Panama Canal Restrictions Prompt THE Alliance to Seek Alternative Routes via Suez Canal

  • The Alliance’s ocean carriers have decided to suspend Panama Canal transits until February for three of their weekly container services between the US and Asia. In response to the ongoing drought in the region, leading to increased delays for vessels, the Panama Canal Authority has imposed significant restrictions on ship transits. These restrictions are expected to become even more stringent in the upcoming months. Consequently, the carriers have opted for longer sea routes through the Suez Canal to navigate these challenges. (JOC)

November 27th: Efficient Terminal Operations as Container Dwell Time Reaches Yearly Low in Ports of NY/NJ

  • Container Dwell Time, the time a container sits at the port after being discharged from the vessel, at the Ports of NY/NJ is at one of the lowest levels of the year at 2.17 days, indicating that terminal operations, on average, are flowing relatively smoothly. 

November 20th: US Retailers Anticipate Record Holiday Sales Despite Lower Import Volumes Throughout the Year

  • In October, US imports from Asia reached the highest point in 2023, with containerized imports increasing by 5.9% from September and 12.4% from October 2022, as retailers rushed to stock up ahead of the holiday sales season. (JOC)
  • Despite the October surge, year-to-date imports were down by 16.6% YoY, attributed to softer import volumes throughout the year due to factors such as inflation and high-interest rates.
  • However, US retailers are still anticipating record holiday sales this year of $966.6bn, up 3% to 4% over last year, and the Global Port Tracker forecasts continued year-over-year growth in imports at least through March 2024.

November 13th: Port of Houston Experiences Growing Congestion

  • Over the past 2 weeks, ocean container dwell time at the Port of Houston increased by a full day, to 4 days wait time, for picking up a container once discharged, indicating increased congestion.

October 30th: NACPC Launches MPOC to Double Chassis Pool and Boost Interoperability in Memphis

  • The North American Chassis Pool Cooperative (NACPC) has launched the Memphis Pool of Choice (MPOC) in response to frustration among truckers and cargo owners with restrictions on chassis used for hauling ocean containers. The goal is to double the pool’s current 2,500 units within a year, with NACPC and Milestone Equipment Holdings as primary chassis suppliers. (JOC)
  • MPOC aims to promote interoperability, allowing any chassis to be used with any container. NACPC is competing with Consolidated Chassis Management (CCM) in the Memphis market, claiming to offer a better chassis pool, while CCM believes NACPC’s approach may further fragment interoperability and hinder efficiency. (JOC)

October 23rd: Trans-Pacific Carriers Turn to Lázaro Cárdenas Port to Overcome Draft Limitations at Panama Canal

  • Trans-Pacific ocean carriers are increasingly using Mexico’s Port of Lázaro Cárdenas as an alternative route to reach the US Midwest, bypassing the draft limitations of the Panama Canal. This shift is driven by the desire to tap into the port’s strategic advantages and growing intermodal opportunities. (JOC)
  • Although Lázaro Cárdenas is the second-busiest container port in Mexico, it was not a regular stop for trans-Pacific services. However, this is changing rapidly. Carriers like Zim Integrated Shipping are now adding it as a direct call, creating a gateway for US-bound cargo with an emphasis on selected US inland destinations.

October 16th: West Coast Ports Report Surge in Market Share for US-bound Freight from Asia

  • US Imports from Asia show a slight YoY gain in September at +1.4%, up from August’s -14.7% YoY. A significant portion of this freight has landed on the West Coast. Port and terminal sources are confident the uptick in West Coast market share will continue. (JOC)
  • Gene Seroka, executive director of the Port of Los Angeles, said retailers in September began to return an increasing share of their discretionary cargo to the West Coast following the ILWU contract ratification. Key items to watch for shippers looking to move freight back to the West Coast are the Panama Canal water levels and the East Coast ILA contract negotiations ahead in 2024. (The Business Journals)

October 9th: Port of Savannah Battling Backlog of Vessels Amid Recent Closures

  • The Port of Savannah is working its way through a backlog of 16 vessels that have been stacking up in recent weeks amid a string of closures. While shippers say the situation – which could linger through mid-November – is less than ideal, many noted there has been no significant impact yet. (JOC)
  • Savannah’s Container Discharge Dwell time is currently 2.37 days, which is in line with where it has been through the summer; it’s also the shortest of the major ports across the country.

October 2nd: PN2 Service Absorbs Calls as The Alliance Cancels PN3 Service Following Market Turmoil

  • The Alliance, a group of major ocean carriers, has suspended its Pacific Northwest 3 (PN3) service due to the current market situation, adding to a series of canceled sailings and service changes aimed at balancing ship supply with import demand. The Pacific Northwest 2 (PN2) service will absorb calls to the Asian ports previously served by PN3. (The Loadstar)
  • The trans-Pacific trade route is experiencing significant service cuts and blank sailings as Asian imports to the US decline. Drewry’s canceled sailings tracker indicates that the trans-Pacific will account for the majority of canceled sailings between mid-September and the end of October, potentially leading to schedule disruptions and delays for shippers and beneficial cargo owners.

September 26th: Container Shipping Industry Takes Bold Steps Towards Decarbonization with Green Corridor Announcement

  • A green shipping corridor was announced between the ports of LA, Long Beach, and Shanghai to combat the global climate crisis. These are accelerated decarbonization efforts steps in reducing the emissions of container ships, but that comes at a cost which would be pushed to down to the customer. Some analysts are expecting costs to be in the trillions over the next 2-3 decades.
  • Zim, one of the worlds largest shipping lines, is looking to take advantage of the Port of Savannah’s expanded refrigerated cargo infrastructure by creating a direct route to the West Coast of South America.

September 18: On-Time Performance for Trans-Pacific Vessels Set to Plummet as a Result of Mass Cancellations

  • Trans-Pacific lines are responding to the weak import volumes by blanking 200k+ TEUs of capacity in September and have announced an additional 370k+ TEUs in blanks for October, about 14% of trans-Pacific capacity, according to Sea-Intelligence.,
  • To prevent freight rates from collapsing, trans-Pacific carriers will reduce effective capacity through a “massive number of blank sailings,” Alan Murphy, CEO of Sea-Intelligence, said. Those canceled sailings will drag down vessel on-time performance, which is already at the dismal levels ~40% to the West Coast and ~39% to the East Coast.
  • Given the above, and less any major disruption or enormous surge in demand, shippers should expect low container rates and low service levels heading into 2024.

Recent Posts

STAY INFORMED AND UP TO DATE WITH THE LATEST DRAYAGE NEWS
dry van shipping
WHAT IS BILL OF LADING?
Q1 2024 TRANSPORTATION OUTLOOK

Q1 2024 TRANSPORTATION OUTLOOK

Back to Resources

Feb 12, 2024

Q1 2024 Transportation Outlook

News

Change is coming in the transportation industry. Rising spot rates bring increased volatility. Are you ready to navigate the coming year with a sound strategy? Our Q1 2024 Transportation Outlook informs you about key events that will influence the timing and magnitude of the volatility.

We will cover:

  • How are macro-economic indicators such as imports, Personal Consumption Expenditures (PCE), the inventory-to-sales ratio and industrial production influencing freight demand?
  • How much capacity remains from the pandemic and when will there be a balance of supply and demand?
  • What is the current state of Truckload Spot and Contract Rates and where are we predicting rates to go over 2024?
  • What can be expected for other transportation modes like Drayage, Less-Than-Truckload (LTL) and Parcel?

We know not everyone has time to read the entire outlook, so if you’re one of those who just want to get pointed to exactly what you’re looking for click below to jump to a certain section:


In The News and What to Watch

Inflation & Interest Rates

  • The US Federal Reserve’s preferred measure of inflation stayed at +2.6% year-over-year (YoY) and has been trending lower.
  • The Core Price Index (CPI) rose by 0.2% in December and was +2.9% YoY. This is the lowest rate of inflation since February 2021.
  • Prices for durable goods dropped by 2.3% YoY. Disinflation has been primarily driven by falling prices in furnishing, durable household equipment, recreational goods and vehicles.
  • Inflation for services also fell below 4% YoY for the first time since June 2021.
  • Interest rates remain high and make financing large purchases difficult for many. Rates will decline somewhat in the coming year but will likely remain elevated.
  • We also expect the YoY growth in housing prices to continue decreasing over the coming months.

The Fed’s Latest Update

  • The Federal Reserve maintained the target range for the federal funds rate at 5.25% to 5.5% after the February meeting.
  • While ruling out a rate cut in March, the Fed emphasized the need for greater confidence in sustained inflation movement before considering reductions.
  • The FOMC’s statement hinted at future policy adjustments, with a focus on assessing incoming data and balancing economic growth with inflation control.
  • Economists anticipate a “soft-landing” scenario, where the Fed can curb inflation without jeopardizing economic growth.
  • The central bank’s continued attention to economic indicators reflects a cautious approach, maintaining its highest targeted range for the federal funds rate in almost 23 years.

Consumer Confidence and Purchasing Power

  • One of the leading indicators of consumer spending is consumer confidence, or how the consumer feels about the current and future economic situation.
  • January’s US Consumer Confidence report indicated that the consumer is the most confident it has been since December 2021, with a 6.8-point increase from December 2023. This positive reading marked the third straight monthly increase.
  • Real Disposable Personal Income rose by 0.1% in December and was 3.7% higher YoY indicating an increase in purchasing power.
  • Savings that went up in November fell back to 3.7% in December.

Student Loan Repayments

  • In October 2023, Congress ended the student loan repayment pause that has been in effect since March 2020, which impacts roughly 25% of US consumers.
  • There was concern that the resumption of student loan payments would curtail consumer spending. However, contrary to many analysts’ expectations, the consumer remained resilient.
  • In a January 26 survey conducted by the University of Michigan, 60% of respondents who currently hold student loans claimed they would not spend less because of the repayment resumption.
  • Of all consumers, including those who do not have student loans, only 8% of the population plans to spend less.

Lunar New Year, Suez and Panama Canal Effects on Imports

  • Lunar New Year will run from February 10 to February 24. Lunar New Year’s effect on shipping includes heightened shipment volumes and increased rates leading up to the holiday, as well as extended wait times for containers during the holiday.
  • Currently, in the Asia-US trade sector, ocean carriers are rushing to implement general rate increases (GRIs) before the Lunar New Year, proposing hikes ranging from $600 to $1,000 per forty-foot equivalent unit (FEU), which will be in effect from February 1 to February 15.
  • Carriers also implemented GRIs earlier this month with the East Coast spot rate increasing from $4,050/FEU to $6,166/FEU and the West Coast spot rate increasing from $2,800/FEU to $4,100/FEU, according to Platts/JOC.
  • Carriers are also applying various surcharges like peak-season surcharges, war-risk surcharges and Panama Canal surcharges. The effectiveness and stickiness of these increases is uncertain.

Parcel: Money Back Guarantees, Demand Surcharges and GRIs

  • UPS announced in their Q4 2023 earnings call in January, that their US Domestic average daily volume declined by 7.4% compared to the prior year.
  • Air to Ground shifts: UPS’s total air daily volume was down 15% compared with the prior year as shippers shift volume out of the air onto the ground. FedEx announced its Express unit will lose half of its business with the United States Postal Service (USPS) when their existing contract expires. Both announcements follow the trend of shippers moving more volume from air to ground.
  • Demand Surcharges: Both FedEx and UPS announced in January they will implement demand surcharges and fees ranging from $2.00 up to $40.00 per package.
  • General Rate Increases: USPS announced price changes in January, with USPS Ground Advantage increasing by 5.4%, Priority Mail increasing by 5.7% and Priority Mail Express increasing by 5.9%.
  • Money Back Guarantees: UPS and FedEx both announced they would reinstate money-back guarantees on 2 Day Air AM service.

Core Macro-Economic Metrics

The freight industry is slowly returning to pre-Covid levels after years of turmoil brought on by massive macroeconomic developments. This stabilization is attributed to the resilient consumer, a measured recovery in manufacturing, an ongoing inventory depletion triggering potential restocking and positive trends in imports, particularly in containerized shipments.

While the next cycle is upon us and we will eventually see a shift in pricing power away from shippers, these factors cautiously suggest the freight industry is on track to return to its normal cycles, instead of the massive peak and valley experienced the past 3 years.

Source: Bureau of Economic Analysis (BEA), Federal Reserve, Census Bureau, Bureau of Labor Statistics

More Info:

Real Personal Consumption Expenditure (PCE)

  • PCE increased by +2.6% YoY in Q4 driven by both durable and non-durable goods indicating strong consumer sentiment.
  • Consumption of durable goods increased by 6.1% YoY while non-durable goods were up by 2.2% YoY.
  • Unlike the previous quarters where the spending was driven by gasoline and drugs, spending in Q4 was mostly driven by freight-generating sectors.

Industrial Production (IP)

  • IP for Q4 finally settled at -0.2% YoY which marks the first deflationary quarterly readings since Q1 2021.
  • Manufacturing Output, on the other hand, improved from -0.8% YoY last quarter to -0.5% YoY in Q4 coming out of automotive strikes.
  • The US manufacturing sector continued to contract, as per ISM PMI report, but at a slightly slower rate in December as compared to November.
    • The PMI for December came out 47.4% against 46.7% in November 2023.
    • Companies are still managing outputs appropriately as order softness continues.

Inventory to Sales Ratio

  • Inventory to Sales Ratio for November came to 1.37, which is the same as October.
  • On a YoY basis, the ratio went down by 0.6% which indicates that the inventories continue to deplete.
  • Sales went up by 1.0% YoY largely contributed by the retail sector in November.
    • At the same time, the retail inventories continue to stay high at +5.3% while wholesale inventories dropped by -3% YoY.
    • If the inventories continue to deplete triggering the restocking and the consumer base stays resilient, we should see increased freight activities soon.

Imports

  • Imports went up 0.5% in Q4 and were at -0.2% YoY against -1.7% in Q3.
    • Container imports growth turned positive after five quarters of decline and was at +6.6% YoY in Q4.
    • Significant increase in TEUs volume across the West Coast after eight quarters of volume decline. Port of Long Beach/Port of LA saw more than 25% YoY growth in TEU volume.

Freight Demand Metrics

Freight demand is currently at the lowest level in the past 13 quarters. However, it’s not the lowest it ever has been such as during periods during or following recessions. This is partially due to resilient consumers continuing to spend on goods even with the headwind of inflation.

Source: Cass Freight Index

Chart-2-Cass-Freight-Index-scaled

More info:

  • Freight volumes represented by CASS Freight Index show the continued decline in demand for the fifth consecutive quarter.
  • With December 2023 readings, Q4 2023 reported at -8.5% YoY, which is also 0.6% lower than Q3 2023.
  • The index for December 2023 and Q4 2023 is at its lowest in the past 13 quarters, indicating freight demand is at the lowest point in over three years.

Freight Supply Metrics

For five consecutive quarters, capacity reduction continues in this oversupplied capacity market. The last quarter of 2023 had the lowest-ever recorded net capacity addition of -7,204 revocations or carriers leaving the market.

For context as to just how much capacity entered the market from 2020 through 2021, when inflationary rates persisted for six quarters, an average of 25,269 new trucking companies were granted operating authority each quarter, surpassing the pre-pandemic average by 2.5 times.

Conversely, in the past six quarters with declining shipping costs, approximately 21,749 trucking companies had revoked their operating authority every three months, more than double the pre-pandemic average.

Comparing the above rates (entry vs. exit in their respective cycles), there is a strong indication that the industry is approaching the necessary supply correction to re-enter an inflationary market. Additionally, Class 8 Truck Orders and Net Orders reported negative figures in Q4 2023 on a YoY basis for the first time since the first quarter of 2022, highlighting a decline in truck order lead time and suggesting that capacity is exiting the market faster than it is entering.

Source: Federal Motor Carrier Safety Administration (FMCSA)

Chart-3-New-Authorities-Revocations-scaled

More Info:

  • Carrier revocations or exits continue to outpace new grants of authority for the fifth consecutive quarter, confirming the continued exit of capacity in an oversupplied market.
  • During the peak of the last freight cycle, in which we experienced 6 quarters of inflationary rates, 25,269 new trucking companies were granted operating authority each quarter. This is 2.5 times the quarterly average pre-pandemic.
  • On the flip side, during the last six quarters when shipping costs have been dropping, around 21,749 trucking companies have had their permission revoked every three months. Again, this is more than double the pre-pandemic average.
  • Since all the revocations are not reported to FMCSA, taking these numbers into account, we can deduce that we are nearing the supply correction needed to re-renter the inflationary market.
  • Retail Sales for Class 8 TR Orders went negative (on a YoY basis) in Q4 2023 for the first time since Q1 2022.
    • Net Orders also reported a negative 4.3% YoY in Q4.
    • Declining truck order lead time is a strong indicator of capacity exiting the market faster than capacity is willing to enter.

The good news is we’ve passed the bottom and are moving ahead into the next cycle. While analysis is important, if all you do is analyze data endlessly or wait for all the information, you’ll miss your chance to act. We learned from past cycles; where we’ve made mistakes and where we were right on the money. Reflecting on 2017 to 2018, what actions did you take? After that freight cycle, we saw routing guides fall apart, rate volatility, and rising costs for shippers. No two cycles are the same; however, we believe this next cycle will have similarities to ’17 and ’18. Keep that in mind as you are planning for this year and for the long run.”

Drew Herpich

Chief Commercial Officer at TI & NTG

TL Spot & Contract Curve (% YoY Change by Quarter)

What is the Beon Band?

The Beon™ Band rolls up YoY quarterly averages of spot and contract freight data to create projections for future freight cycles. This band is the outcome of the relationship between freight supply and freight demand, with freight demand being driven by the macroeconomic demand indicators. When we overlay the Beon™ Band with the demand curve in a single chart, we can see demand’s influence on the to-the-truck costs.

Source: Beon Band – Transportation Insight Holdings

Chart-4-TL-Spot-Contract-Beon-Band-scaled

When the Beon Band is overlayed with the macroeconomic indicators of freight demand, we can begin to understand how some of these factors are impacting freight rates and thereby forecast where we see the market going over the next couple of quarters.

Chart-5-beon-band-vs-economic-demand-scaled

Rate Forecast

Spot: Rates are climbing upward toward YoY inflationary. Capacity continues to exit the oversupplied freight market, which has seen declining demand over the past six quarters. We expect the market to eventually turn inflationary in Q1 2024, with a projected YoY increase of +2.5%. This suggests that in Q1 2024 truckload spot rates will surpass Q1 2023 truckload spot rates. Consumer demand is expected to rebound in the second half of the year. Moving into Q2 2024, we anticipate a faster YoY increase in inflationary rates averaging 10% to 15%.

Contract: After bottoming out in Q2 2023, with rates 13.9% lower than Q2 2022, rates have been gradually rising. The fourth quarter of 2023 reported a decrease of 7.3% YoY. We anticipate contract rates to gradually increase to -5.0% YoY in Q1 and fall within the range of –2.5% to 0% in Q2. Our projection indicates that the curve will turn inflationary on a YoY basis in Q3 2024. It is important to note that the contract curve typically lags the spot curve by approximately two quarters.

Carrier revocations of operating authority have outpaced new grants for five consecutive quarters, resulting in the continued reduction in capacity. This indicates that the market is ready to enter an inflationary leg of the freight cycle in late Q1 and early Q2. Shippers should review their transportation and procurement strategy, if not already, to ensure they have the right balance between cost and service to minimize routing guide disruption when capacity gets tighter and spot rates become more attractive than the contractual rates for carriers.”

Amit Prasad

Chief Data Science Officer at TI & NTG

Port to Porch Market Forecast

Drayage

Navigating through the remainder of Q1 2024 and into Q2, the drayage transportation landscape is poised for notable shifts and challenges. Notably, from February 10 to 16, Chinese ports will be closed in observance of the Lunar New Year. Consequently, between February 13 and March 22, a significant reduction in US import volumes from Asia is anticipated, with a projected return to relative normalcy in the last week of March. We say relative normalcy as it is crucial to note that other global events are impacting ocean traffic.

The water level limitations in the Panama Canal pose constraints on the passage of large vessels connecting Gulf and East Coast ports to Asia. Simultaneously, challenges are exacerbated by issues in the Suez Canal. Furthermore, the impending contract negotiation of the International Longshoreman Association (ILA) in Q3 raises concerns about potential labor disruptions and strikes in Gulf and East Coast ports, compelling shippers to seek more stable alternatives. These dynamics suggest a shift in import volumes back to the West Coast, positioning it to reemerge as the majority shareholder of US imports in 2024.

In summary, the first half of 2024 is anticipated as a strategic period for shippers to align their strategies and transition their routes to the West Coast where possible, paving the way for a pivotal Q3/Q4. Indications strongly point toward a significant rebound in West Coast ports, particularly in Los Angeles and Long Beach and perhaps even the Pacific Northwest, presenting an opportunity that necessitates preparedness and strategic capitalization.

Less-Than-Truckload

Looking back at Q4 2023 data, LTL tonnage and shipment count continued to decline in Q4, but the rate of decline slowed down. Per American Trucking Associations (ATA), the LTL tonnage index for Q4 was 7.4% lower on a YoY basis against 9.8% in Q3. Revenue per shipment went up in Q4 by 1.4% but is still 1.1% on a YoY basis. There is a strong correlation between the Purchasing Managers’ Index (PMI) reported by ISM and LTL tonnages reported by ATA which also suggests continued industry volume declination but the rate of decline slowing down

Chart-6-ISM-PMI-vs-YoY-Change-in-LTL-Tonnage-by-Quarter-scaled

Looking into 2024, the first quarter is typically a softer market for LTL, which is proving to be true this year. Despite this, Yellow’s exit and further consolidation in the marketplace is counteracting the downward pressure on rates. As a result, the LTL market is currently balanced. While LTL carriers have capacity, they are targeting specific areas where there is a need within their networks rather than devaluing their services.

Transactional pricing is fully embraced by LTL carriers today but is much more strategic than in the past. When combined with API technology, carriers can precisely target the lanes where they need freight and adjust as often as needed.

LTL carriers are adopting a similar approach with contractual pricing. While incumbent carriers are still seeking increases, they are also exploring new business opportunities where they are not hauling today. As a result, customers can expect to see a mix of rate adjustments where some lanes may increase, while other lanes may decrease in their contractual rates.

Parcel

Despite the availability of capacity and carriers trying to regain volume, the actions and rate increases implemented by carriers do not align with that current state. It is noteworthy that even with volume significantly down, UPS and FedEx are still charging demand surcharges.

One of the most notable changes with national carriers surrounds the reinstatement of some of their money-back guarantees on certain service levels. The second most noteworthy change is around UPS’s Q4 2023 earnings call.

Based on this call, UPS mentions that they will shift focus back to SMB shippers. For context from 2020 to 2021, more than half of UPS’s shipper base was SMB shippers. UPS CEO Carol Tome mentioned at the end of 2023, around 28% of their shipper base was SMB shippers, and that would be a critical focus for 2024. With volume significantly down for not only UPS, but also FedEx and other regional carriers, parcel carriers are eager to regain volume back into their networks.

Based on our Parcel team’s feedback and some recent contract negotiations we have seen from customers, here is what you need to know and how we recommend you plan for 2024.

For SMB parcel shippers, now is the time to try and renegotiate any small parcel contract you have. Typically, SMB shippers are aggregating their spending with one carrier. But it may be worthwhile to look at other carriers out there, especially given that UPS has blatantly announced the focus on the SMB parcel shipper segment.

For large and enterprise parcel shippers, while your volume is down and while carriers (even regionals) are getting competitive with pricing, plan for future state and diversify. Be planning for the next three to five years. If you can lock in long-term pricing now and determine new carriers you can introduce, and how you can better equip your network and your infrastructure to support multiple carriers, then once demand does catch up – your parcel strategy will be more resilient.


Leadership Talking Points

We’ve now addressed key events to watch this quarter and this year, the current state of macro-economic demand indicators and freight supply indicators, our forecasted truckload spot and contract rates, as well as our port-to-porch forecast. Armed with that information, here’s how you can answer some of your executive team’s questions about what to expect in 2024:

  • What is the current state of freight? The bottom of the market is behind us and we’re on the way into inflationary territory. As a result, there will be volatility in the form of rising spot rates and eventually rising contractual rates. In the last year and a half, rates were relatively consistent in terms of the spread between contract and spot. This year we will experience the shift when spot rates become more expensive than contract. This cross-over will bring volatility as carriers tend to gravitate toward freight that earns them more money per load.
  • What does this mean for shippers? Slowly but surely, like any prior freight cycle, enough capacity will exit the industry for there to be a balance between supply and demand. As enough capacity attrition occurs, carriers begin to push back on shippers’ rates and we begin to see rate renegotiations. Many carriers will also likely renege on contractual freight and chase higher rates on the spot market, which will break apart routing guides and make shipping freight more costly.
  • Transportation costs are still low, and we have no trouble finding trucks to move our freight. The freight market is like a faucet, not a light switch. Market transitions don’t happen instantly, but rather slowly, like the faucet slowly turning on. This is currently happening with stronger demand indicators and reduced capacity, signaling the shift into the next cycle. As carriers continue to exit the market, freight demand will rise, leading to significant changes. It’s important to note that during market changes, it’s not a sudden switch, but a gradual opening of the faucet.
  • Okay, so what do I do now? Keeping in line with the suggestions we put out in the Q4 Outlook, you can take the following measures to protect yourself from the volatility that is to come in 2024.
    • Ensure partner stability. Routinely assess partners’ financial and operational soundness to safeguard your supply chain – don’t just look at on-time performance and cost.
    • Evaluate shipping lanes. Assess high-volume and irregular lanes for partner reliability, seek contract opportunities – especially with blind spot lanes in your network – and determine a network of asset and non-asset carriers. While consolidation is important, it’s crucial to strike a balance that avoids vulnerability and preserves flexibility.
    • Optimize your network. Look at supplier and customer networks and determine ways to optimize. Implement quick wins based on the findings and incorporate the rest into your long-term strategy.
    • Renegotiate parcel contracts. If you ship parcel, even if you aren’t in a renewal period, it may be a good time to reach out to other carriers. Some carriers are getting very competitive with rates even for SMB shippers, so look at regionals, nationals and the post office now.

Recent Posts

STAY INFORMED AND UP TO DATE WITH THE LATEST DRAYAGE NEWS
dry van shipping
WHAT IS BILL OF LADING?
Q1 2024 TRANSPORTATION OUTLOOK

LTL CARRIER HOLIDAY REMINDER 2023

Back to Resources

Dec 20, 2023

LTL Carrier Holiday Reminder 2023

News

Check out the calendar for closure dates for less-than-truckload carriers this holiday season.

CARRIER22-Dec25-Dec26-Dec29-Dec1-Jan
Day of the WeekFMTFM
AAA Cooper TransportationCLOSEDCLOSEDCLOSED
ABFCLOSEDCLOSED
ACI Motor FreightCLOSEDCLOSED
A Duie PyleCLOSEDCLOSED
Averitt ExpressCLOSEDCLOSEDCLOSED
Central TransportCLOSEDCLOSED
Cross Country Freight SolutionsCLOSEDCLOSED
Day & RossCLOSEDCLOSEDCLOSED
DaylightCLOSEDCLOSED
Dayton Freight LinesCLOSEDCLOSEDCLOSED
Dependable Highway Express, IncCLOSEDCLOSED
Dohrn Transfer CompanyCLOSEDCLOSEDCLOSED
Dugan Truck LineCLOSEDCLOSED
EstesCLOSEDCLOSEDCLOSED
FedEx EconomyCLOSEDCLOSED
FedEx PriorityCLOSEDCLOSED
FFE Transportation ServicesCLOSEDCLOSED
Forward AirCLOSEDLimited OpsCLOSED
Frontline Freight Carrier USACLOSEDCLOSED
Magnum LTLCLOSEDCLOSED
Midwest Motor ExpressCLOSEDCLOSEDCLOSED
MJB FreightCLOSEDCLOSED
Mountain ValleyCLOSEDCLOSED
New Penn Motor Express, IncCLOSEDCLOSED
Oak Harbor Freight LinesCLOSEDCLOSEDCLOSED
Old DominionLimited OpsCLOSEDCLOSED
One Way Express OhioCLOSEDCLOSED
Pace Motor LinesCLOSEDCLOSED
PENINSULA TRUCK LINESCLOSEDCLOSED
Pitt Ohio ExpressCLOSEDCLOSEDCLOSED
R&L CarriersCLOSEDCLOSED
RoadrunnerCLOSEDCLOSEDCLOSED
Ross ExpressCLOSEDCLOSED
SaiaCLOSEDCLOSEDCLOSED
Southeastern Freight LinesCLOSEDCLOSEDCLOSED
Southwestern Motor TransportCLOSEDCLOSED
Standard ForwardingCLOSEDCLOSED
Sutton TransportCLOSEDCLOSED
Tax-AirCLOSEDCLOSED
TForceLimited OpsCLOSEDCLOSEDCLOSED
Total TransportationCLOSEDCLOSED
U.S. Road Freight ExpressCLOSEDCLOSED
US Special DeliveryCLOSEDCLOSED
Vocar TransportationCLOSEDCLOSED
WardCLOSEDCLOSEDCLOSEDCLOSED
XPO LogisticsCLOSEDCLOSEDCLOSED

Recent Posts

STAY INFORMED AND UP TO DATE WITH THE LATEST DRAYAGE NEWS
dry van shipping
WHAT IS BILL OF LADING?
Q1 2024 TRANSPORTATION OUTLOOK

DRAYAGE PER DIEM CHANGES COMING IN 2024

Back to Resources

Dec 14, 2023

Drayage Per Diem Changes Coming in 2024: A Positive Step for Shippers

News

The shipping industry plays a crucial role in global trade, facilitating the movement of goods and ensuring supply chain efficiency. However, challenges like penalty charges for delays in returning containers have long been a concern for shippers.

To address these issues and establish regulatory oversight, the Ocean Shipping Reform Act of 2022 (OSRA) was enacted. In 2024, there will be changes in Drayage Per Diem regulations as a result of OSRA and highlight the benefits they bring to shippers.

Proactive Measures to Avoid Penalty Charges

One of the key aspects of OSRA is the implementation of regulatory oversight on ocean carrier practices. The specific focus on per diem aims to proactively avoid penalty charges for delays in container return. By increasing oversight, the frequency and total amount of charges should be reduced, eliminating the need to go back three years to recoup losses. These changes will provide a more transparent and fair system for shippers.

Empowering Shippers and Increased Collaboration

While the new regulations are expected to improve processes, it is crucial for shippers to stay vigilant and be proactive in managing these charges. Working with a carrier who can fight on your behalf will be crucial, especially given the smaller window of time to address disputes. Shippers must take control of their operations and actively monitor and respond to any potential issues related to per diem charges.

Aiding Customers and Shippers

Aside from addressing penalty charges, OSRA 22 also aims to aid customers and shippers in other areas of the shipping process. One significant aspect is the focus on ocean rate practices. These changes will ensure more transparency and fairness in pricing, benefiting shippers by allowing them to make informed decisions.

Another area of focus is equipment availability and returns. Through the requirement for port operators, chassis owners and providers with a fleet of over 50 chassis to submit dwell time statistics to the Federal Maritime Commission (FMC), shippers will gain valuable visibility into equipment availability and dwell times. This information will allow for better planning and avoiding unnecessary delays.

Positive Impacts on Shippers and Customers

Overall, the changes brought about by OSRA 22, specifically the Drayage Per Diem regulations, are a positive development for shippers. The aim of these changes is to eliminate discriminatory practices from ocean carriers, provide greater visibility into the shipping process and improve the efficiency of ports.

By enhancing regulatory oversight, reducing penalty charges and increasing transparency, OSRA 22 enables shippers to have greater control over their operations and avoid unnecessary costs.

In conclusion, the 2024 Drayage Per Diem changes coming due to the Ocean Shipping Reform Act of 2022 bring significant benefits to shippers. By eliminating discriminatory practices, increasing visibility and promoting efficiency, these changes empower shippers to make informed decisions, avoid unnecessary charges and contribute to a more robust and reliable global supply chain.

Recent Posts

STAY INFORMED AND UP TO DATE WITH THE LATEST DRAYAGE NEWS
dry van shipping
WHAT IS BILL OF LADING?
Q1 2024 TRANSPORTATION OUTLOOK

Q4 2023 TRANSPORTATION OUTLOOK

Back to Resources

Nov 06, 2023

Q4 2023 Transportation Outlook

News

A year ago, in Q4 2022, every indicator pointed to an economic climate unlike anything we’d ever experienced. We advised shipper and carrier partners to take the long view and develop a strategy that enabled them to fluidity navigate market shifts vs. exhaust resources by reacting to every jolt.

Ultimately, easier said than done. We can all agree that 2023 has been one for the books and difficult to navigate. As we close out the year, a lot of questions remain:

What is top of mind for shippers:

  • When is the next inflationary freight cycle?
  • What should I be looking for/doing now to stay ahead of this?
  • Do I have the right 2024 RFP strategy?

What is top of mind for carriers:

  • Will there be enough freight demand in the first half of 2024 to stay in business?
  • Will rates rise enough to cover inflated operating costs?
  • Am I working with the right 3PLs and customers?

Before we dive into this quarter’s edition of our Transportation Outlook, inclusive of our macroeconomic update, spot and contract rate forecasts and top tips for shippers and carriers, it’s important to align on today’s freight market landscape.

Since Q3 2022, spot rates have been slowly on the rise year-over-year (YoY) with contract rates following suit. We know the market is turning…the ultimate question is, at what velocity and magnitude will we see rates increase in 2024? How will record-high interest rates impact this?

As it stands, we predict that YoY change in spot rates will be around –2.5% at the end of Q4 2023. Our forecast positions spot rates to turn YoY inflationary in Q1 2024 and continue their ascent through the entirety of the year. With contract generally lagging spot by two quarters, we predict contract rates to follow spot on the journey upward moving from –11.2% in Q3 2023 to –7.5% at the end of Q4 2023.


Truckload Market Fundamentals

Just as we did last quarter, let’s revisit the fundamentals and key indicators that inform this forecast.

Supply | Carriers have exited, but there is still an oversupply of capacity relative to demand.

Since the middle of 2022, there hasn’t been a month where Carrier Net Revocations of Operating Authority has been less than 6,000. However, given the sheer volume of new entrants that burst onto the trucking scene during the pandemic (over 120,000 operators), we still have months to go until we see a normalization of carriers compared to the relative demand levels.

Freight Supply Metrics

NewAuthorities

Demand | Consumers have been resilient but are spending more consciously headed into 2024.

The consumer has proved to be resilient this year, but with record high consumer credit levels, resumption of student loan repayment and persistently high inflation, the consumer is beginning to tighten the wallet and focus on essentials. This is a signal that consumers are concerned about the future of the economy and as a result, we may see a reduction in goods purchases and thereby a reduction in freight demand.

Cass Freight Index: %YoY Change by Quarter

NTG Freight-Index Chart 3 scaled

Source: Cass Freight Index

  • Freight volumes represented by CASS Freight Index show the continued decline in demand for the fourth consecutive quarter.
    • With Sep. 2023 readings, Q2 2023 reported at –8.1% YoY, which is also 1.6% lower than 2023.
    • The index for August and Q3 2023 is at its lowest in the past quarter, indicating freight demand is at the lowest point in over two years.

Consumer Sentiment | Buying behavior is shifting to essentials only for many households.

The October Consumer Sentiment report from the University of Michigan came in lower than expected at 63.8, down 6% from Sept. 2023. The Consumer Expectations Index, which depicts consumers expectations for the future, declined 6.5% from September into October, to 59.3.

Inflation | Inflation made a comeback in Q3 and remains well above the Fed’s stated target.  

The Consumer Price Index (CPI) went up to 3.7% on YoY basis with energy prices being the primary driver. Personal Consumption Expenditure (PCE) index reported by BEA also shows inflation picking up for non-durable goods while durable goods further deflated in Q3. However, inflation remains high in the services sector with YoY growth close to 5% in Q3.

Interest Rates | Interest rates continue to rise each quarter and may rise again in Q4 2023.  

Roughly 70% of the US GDP is based on consumer spending. The Federal Reserve Bank has increased interest rates each quarter since Mar. 2022, when we saw an increase from 0.25% to 0.5%, and the latest being 5.25% to 5.50% reported on July 26, 2023. There is talk of another potential rate hike in Dec. 2023 of 0.25%.

Consumer Debt | Household debt is steady, signaling saving vs. spending behavior.

As interest rates increase, consumer debt also increases. According to the Federal Reserve Bank of New York, total household debt rose from $16 billion, or 0.1%, in Q2 2023. This is much less of an increase in overall debt levels when compared to the Q1 2023 increase of 0.9%, indicating that either consumers are running out of available credit or that they are being more cost-conscious when spending on credit cards.

The Key Economic Indicators: The Cause (% YoY Change by Quarter)

Key Economic Indicators

Source: Bureau of Economic Analysis (BEA), Federal Reserve, Census Bureau, Bureau of Labor Statistics

  • Real Consumption (Personal Consumption Expenditure (PCE) went up by 1% in Q3 2023 on a seasonally adjusted basis. The robust consumer spending reflects an optimistic side of the economy while inflation continues to be above the Fed’s target rate.
    • Real PCE went further up to +2.4% on YoY basis as compared to +1.8% in Q2 2023 with the goods sector showing significant signs of recovery.
    • Consumption for durable goods went up from +3.2% in Q2 2023 to +4.9% in Q3 2023 YoY primarily coming from a 6.2% YoY increase in consumption for motor vehicle and parts.
    • Non-durable goods reported +1.3% YoY consumption after staying low-to-negative for the past five quarters.
    • Consumption in services was slightly up at 2.4% YoY despite continued high inflation in the services sector.
  • After trending down for 10 quarters and nearly touching the X-axis, Industrial Production (IP) made a slight improvement in Q3 2023 and avoided falling below X-axis. In past years, an IP reading below the X-axis has coincided with an economic recession.
    • Reading for Q3 2023 was reported at +0.1% YoY against 0.02% in Q2 2023.
    • ISM Purchasing Manager’s Index (PMI) also reported 11 months of contraction in US Manufacturing Economy, but the index rose for the third month in a row in Sep. 2023 indicating that the rate of change has begun improving.
  • Imports went up by 1.4% in Q3 2023 but stayed negative at –1.4% on YoY basis.
    • The continued decline is after a record high level of imports in 2021 and first half of 2022, but it’s still higher than the pre-pandemic period.
    • Container imports for Sep. 2023 came in at +0.5% YoY and turned positive YoY after 13 months.
  • The Inventory to Sales Ratio further dropped to 1.37 in Aug. 2023 which is just 0.8% YoY.
    • Sales turned positive YoY in Aug. 2023 after staying negative for five months.
    • Inventory continues to drop from its peak at 20.6% YoY in Jun. 2022 to currently at +1% YoY in Aug. 2023.
    • While the overall ratio is still 0.2%, the manufacturing ratio turned negative YoY in Aug. 2023.
      • All these metrics indicate that manufacturing activities are likely to pick up again, which is a positive signal for increased freight volume.

In this dynamic transportation market, we’re witnessing an acceleration of capacity changes, with both carriers and brokers exiting the industry. Costs are on a gradual, but persistent rise, and this will inevitably shape the upcoming RFP cycle. As we move into Q1/Q2 of 2024, we anticipate a restocking phase if consumers continue to buy with the sales inventory ratio continuing to turnover. In these challenging times ahead, the key is to collaborate with reliable, well-funded partners who are prepared to navigate the uncertainty.”

Drew Herpich

Chief Commercial Officer at TI & NTG

Peak Season | Expect a better peak than 2022, but still underwhelming vs. traditional levels.

Peak activity will be more favorable than last year for bigger players in the retail and ecommerce space. Smaller and mid-size players aren’t expected to see much of an influx. Consumers will continue spending on groceries, clothes and holiday gifts, but it’s more likely that is with the big box retailers.


Suggested Actions for Shippers

Here are our top 3 tips for shippers when preparing for Q4 2023 and 2024:

  1. Ensure your partners are performing, and financially stable. Protect your supply chain by ensuring your partners, vendors and carriers, are financially stable and operationally sound to mitigate risks. Make financial assessments a routine part of your selection process to safeguard your operation.
  2. Identify lane opportunities and blind spots. With continued uncertainty, assess your high-volume lanes and ensure you have partners that meet expectations on price, service and reliability. Next look at irregular, volatile lanes and identify contract opportunities within your current network, if any. Most shippers know 70%-80% of their network, but have blind spots with the remaining 20%-30% of providers. Resolving those blind spots will result in a trusted network of primary and incumbent providers, a mix of assets and non-assets, that enables you to perform more consistently when faced with market disruption. Consolidation is always at the forefront of every shipper’s mind, but consolidating too much can leave you vulnerable and remove your ability to remain flexible.
  3. Don’t be afraid to challenge your supply chain strategy. If you’re struggling to find cost savings opportunities, lean on experts to conduct a supply chain optimization assessment, which will dive deeper into your supplier and customer networks and determine what locations, days, times, etc. are going to maximize savings. Gaining awareness of the opportunities available to optimize your supply chain can bring an added perspective when operating. Take some of these findings and start implementing quick wins where possible and work the rest into your long-term strategy.

Suggested Actions for Carriers

Here are our top 3 tips for carriers when preparing for Q4 2023 and 2024:

  1. Establish a long- & short-term strategy for your operation and communicate it. Whether you have one truck or a fleet, evaluate your needs and preferences, then communicate them to your customers, partners and internal team. With key customers, ask long-term questions about their initiatives, operational pain points, capacity requirements and service expectations. In the short term, make sure you remain adaptable with valued customers by adjusting to market conditions, adopting technology and being proactive with communication that earns trust.
  2. Expand your network and nurture those relationships. Building and maintaining a network of shippers, brokers and other key industry contacts is essential. Focus on fostering clear lines of communication with both current and prospective partners. Networking is not just about making connections but nurturing them through regular updates and proactive engagement. Never put yourself in a position where you’re one relationship away from losing your main source of revenue.
  3. Hold yourself accountable for the investments you’re making. Whether you’re investing in technology, more drivers, improved compensation/benefits, better equipment or new facilities and service offeringsmake sure you are holding yourself accountable for the desired outcomes/KPIs. Carriers should routinely assess the performance of their investments and understand how to turn them into more revenue. Make sure your drivers are meeting the service metrics demanded in today’s transportation market. Evaluate your assets and their ability to handle varying demand and market volatility. Stay focused on the right investments and right partners to position yourself for success long-term.

Truckload Spot & Contract Curve (% YoY Change by Quarter)

What is the Beon Band?

The Beon™ Band rolls up YoY quarterly averages of this data to create trend lines. This band is the outcome of the relationship between freight supply and freight demand, with freight demand being driven by the macroeconomic demand indicators. When we overlay the Beon™ Band with the demand curve in a single chart, we can see demand’s influence on the to-the-truck costs.

Truckload Spot & Contract Cost Curve: %YOY Change by Quarter

Truckload Spot & Contract Cost Curve: %YOY Change by Quarter

Source: Beon Band – Transportation Insight Holdings


Analysis 360 | Checking the Record

What we got right in the previous outlook.

  • Rates are on the climb upward towards the abscissa. With an oversupplied market in a declining demand economy, capacity continues to exit the freight market. We expect Q3 2023 to average out to a -10% YoY change in spot rates when compared to 2022.
    • From our analysis we were nearly right on the mark with the YoY change in Q3 2023 spot rates ending at –12%.
  • We expect that Q3 2023 contract rates will continue to stay at the bottom around -12.5% YoY and start heading upward with Q4 2023 rates projected at -5% YoY.
    • We were close to the mark with our contractual rate forecast with YoY change in Q3 2023 contract rates ending at -11.2%.

Rate Forecast

With freight volume continuing to decline every quarter and capacity not exiting at the pace needed to correct an oversupplied market, we are revising our Q4 2023 and Q1 2024 forecast.

Spot: We expect Q4 2023 to stay deflationary at around –2.5% on a YoY basis. The Spot Band is expected to cross the abscissa in Q1 2024 (delayed by a quarter as opposed to our previous forecast) and turn inflationary at +5% YoY. Moving into Q2 2024, this number is expected to jump in the range +15% to +20% with produce initiating the capacity dislocation.

Contract: Contract rates hit bottom in Q2 2023 at 13.9% and inflected upward in Q3 2023. The Contract Band generally lags the Spot Band by two quarters, but this time the trough of the current deflationary cycle was only a quarter behind. We expect the Contract Band to continue its journey towards abscissa moving from –11.2% in Q3 2023 to –7.5% at the end of Q4 2023.

Source: Bureau of Economic Analysis (BEA), Federal Reserve, Census Bureau, Bureau of Labor Statistics, Beon Band – Transportation Insight Holdings

BeonBandvsEDI

Source: Bureau of Economic Analysis (BEA), Federal Reserve, Census Bureau, Bureau of Labor Statistics, Beon Band – Transportation Insight Holdings

Source: Cass Freight Index, Beon Band – Transportation Insight Holdings

BeonBandvsCass

Source: Cass Freight Index, Beon Band – Transportation Insight Holdings

Robust consumer spending and depleting inventory levels will likely trigger restock manufacturing activity and growth in freight demand in the coming months. This trigger, along with weak truck orders and carriers continuing to exit, will set the stage for an inflationary market in 2024 where spot rates will accelerate upwards and contract rates will follow suit. Shippers should take the opportunity to build resilience in their capacity networks by honoring, or adding, stable and reliable providers that hold strong on rates and service once tested with inflationary market conditions.”

Amit Prasad

Chief Data Science Officer at TI & NTG

Port to Porch Market Forecast

Drayage | The landscape for drayage and import conditions is undergoing a noticeable shift.

Retailers proactively restocked inventories earlier this year, which contributed to lower peak volume in the drayage market, and they currently express confidence in their inventory levels. With uncertainties linked to inflation and higher interest rates, consumers are slower to spend discretionary income and we see a steady decline in projected import volume for the remainder of 2023. As a result, container rates are declining, and ocean carriers have slowed down ships to reduce capacity with the reasoning being present market conditions. We have even seen some of the largest steamship lines make headcount reductions due to confidence levels in ocean demand for the rest of the year and into 2024.

Tip: While the market may potentially “return” in late 2025, the focus for now is to develop a strategy enabling you to navigate shifting import conditions and maintain competitiveness in pricing through the remainder of 2023 and into 2024.

Less-Than-Truckload | The LTL industry remained resilient through volatility this year, but many are contingency planning for further disruption.

With lower demand, the LTL freight market has been able to adapt and stay resilient amidst turbulence this year. Shippers have transitioned Yellow’s business to other providers over several months and most LTL carriers have absorbed the added volume well within their network. Next up, the National Motor Freight Classification changes occur in Dec. 2023, so be mindful of and have a strategy for any impacts to your business.

In preparation for 2024, shippers are assessing the vetting criteria for LTL partners with the events that occurred in 2023 top of mind.

Tip: Ensure that service and rates continue to be a focus but try to dive deeper into carriers’ operational strategies, financial state and cybersecurity practices like you would with your FTL providers. The more information that you get up front, and annually, the better.

Parcel | Carrier Diversification remains a priority, UPS and FedEx maintaining their annual General Rate Increases (GRI), but demand remains soft.

The biggest news in the parcel industry currently relates to 2024 General Rate Increases (GRI) and peak surcharges. The rate increases announced as of this publication are primarily across national options –  UPS, FedEx, USPS, and DHL – but some regional players have also come to the table. UPS’s 2024 GRI AnnouncementFedEx’s 2024 GRI Announcement, and DHL each came in with a 5.9% rate increase but shippers need to be detailed in their impact review as the carriers continue to focus on large, bulky freight and less than optimal delivery regions with substantial YoY increases. U.S. Postal Service (USPS) will also be implementing a 2% rate increase and some regional carriers have recently matched the nationals.

Postal final mile has gathered quite a bit of support recently, with many shippers leveraging USPS’s new service Ground Advantage for improved cost and an opportunity for similar service. To compete UPS rolled out UPS Ground Saver last month.

Tip: Ensure that as you analyze and report on the cost impact of annual price increases focus on accessorial and surcharge increases with zone adjustments.

Recent Posts

STAY INFORMED AND UP TO DATE WITH THE LATEST DRAYAGE NEWS
dry van shipping
WHAT IS BILL OF LADING?
Q1 2024 TRANSPORTATION OUTLOOK

TI & NTG RANKS FOURTH IN 2023 TOP 100 DOMESTIC TRANSPORTATION MANAGEMENT (DTM) 3PLS LIST

Back to Resources

Oct 18, 2023

TI & NTG Ranks Fourth in 2023 Top 100 Domestic Transportation Management (DTM) 3PLs List

News

Logistics powerhouse continues rapid growth through superior customer value creation and service delivery  

Atlanta, GA. – Transportation Insight (TI) and Nolan Transportation Group (NTG), a leading provider of non-asset, tech-enabled logistics and brokerage solutions in North America, today announced it has achieved the number-four ranking on Armstrong & Associates, Inc. (A&A) 2023 Top 100 Domestic Transportation Management (DTM) 3PL providers list based on gross revenue.

“The past 12 months have been incredibly challenging for shippers and carriers large and small. Our experience and longevity in the industry have enabled us to create value for them through any cycle,” said Ken Beyer, CEO, TI & NTG. “This ranking speaks to the trust our customers have in our team of logistics experts, empowered by our technology.”

TI & NTG assists its customers in establishing transportation management and capacity procurement strategies that empower them to navigate today’s economic challenges and prepare for the future. This includes enabling shippers to optimize their domestic supply chain while helping carriers quickly adapt to fluctuations in volume. Leveraging its proprietary digital logistics platform and port-to-porch multi-modal capabilities, TI & NTG plays a pivotal role in helping customers develop more flexible and resilient supply chains.

“This top four ranking is a meaningful testament to our mission of bringing people and technology together and making world-class logistics accessible to every business,” said Drew Herpich, Chief Commercial Officer, TI & NTG. “Giving customers the ability to scale up or down as needed amidst the cyclical nature of the macro economy, and consistently delivering the highest standard of service, is a winning combination for any size shipper.”

Companies on the Top 100 DTM list are ranked based on gross revenue for 2022. Companies surveyed and profiled for the list include global and regional 3PLs, digital freight brokers and freight forwarders, specialized/niche 3PLs, e-commerce fulfillment 3PLs, 3PL divisions within larger 3PLs and more.

Armstrong & Associates is a leading 3PL market research company. See A&A’s full Top 100 Domestic Transportation Management 3PL list here: Top 3PLs: A&A’s Top 100 Domestic Transportation List.

About Transportation Insight Holdings

Transportation Insight Holdings is a combination of Transportation Insight (TI) and Nolan Transportation Group (NTG) and brings people and technology together to make world-class logistics accessible to any business. Together with the support of 2,500 nationwide experts, our proprietary digital logistics platform, Beon, connects shippers with 80,000 carriers to bring on-demand logistics and the capacity to scale as needed. Whether outsourcing their entire logistics operation to us, booking a single load, or something in between, more than 15,000 shippers trust TIH to successfully guide their products from port to porch. To learn more about Transportation Insight and Nolan Transportation Group, visit www.transportationinsight.com and www.ntgfreight.com.

ABOUT ARMSTRONG & ASSOCIATES, INC.

Armstrong & Associates, Inc. (A&A) was established in 1980 to meet the needs of a newly deregulated domestic transportation market. Since then, through its leading Third-Party Logistics (3PL) market research and history of helping companies outsource logistics functions, A&A has become an internationally recognized key resource for 3PL market information and consulting. Visit them online at 3plogistics.com.

Recent Posts

STAY INFORMED AND UP TO DATE WITH THE LATEST DRAYAGE NEWS
dry van shipping
WHAT IS BILL OF LADING?
Q1 2024 TRANSPORTATION OUTLOOK

TRANSPORTATION OUTLOOK 2023- Q3 UPDATE

Back to Resources

Aug 14, 2023

Transportation Outlook 2023 – Q3 Update

News

A tale of two halves

Table of Contents:


Current Overview

The bottom of the freight market is officially behind us. Spot rates are slowly on the rise with contract rates following suit, many retailers have succeeded in clearing out old inventories and inflation levels have declined to 4.6% in June 2023 after reaching a high of 9.1% a year ago.

According to our proprietary analysis, the Beon Band, spot rates in the truckload freight sector hit the bottom of their slump cycle in May 2023 and remained relatively stable through June 2023 with only moderate increases. As we entered July 2023, the holiday weekend acted as a catalyst for rates to spike 10%, however the normal seasonality of a July lull had rates retreating down to levels we witnessed in June 2023.

Currently in early August 2023, the sentiment is that spot rates will continue their journey upward with contract rates following suit.


TL Market Fundamentals

The ultimate question is, at what velocity and magnitude will spot rates increase?

Back to the fundamentals, we know there are two leading indicators that can give us the answer – supply and demand.

Supply: We know for certain the surplus capacity (owner operators and some mid-size carriers) that entered the market over the past three years is exiting due to operating costs, but how quickly will excess capacity be forced to exit?

Demand: The consumer has proved to be resilient this year. However, we must consider the record high consumer credit levels, resumption of student loan repayment and persistently high inflation when examining what future demand will look like. Will demand pick up in Q4 2023? How much more can consumers spend?

There is no crystal ball, but there are strong data points that inform our prediction. Let’s dive in.

Interest Rates
Roughly 70% of the US GDP is based on consumer spending. The Federal Reserve Bank has increased interest rates each quarter since March 2022, when we saw an increase from 0.25% to 0.5%, with the latest increase being 5.25% to 5.50% reported on July 26, 2023.

Consumer Debt
As interest rates increase, consumer debt also increases. According to the Federal Reserve Bank of New York, total household debt rose 0.9% to $17.05 trillion in Q1 2023. Mortgage balances climbed by $121 billion and stood at $12.04 trillion at the end of March 2023. Auto loan and student loan balances also increased to $1.56 trillion and $1.60 trillion, respectively, but credit card balances were flat at $986 billion.

Retail Sales & Inventory
Retail sales remained positive during the first half of the year and significantly contributed to loosening bloated retail inventories. Although, the shedding of inventory came at a price for many retailers running promotions to unload inventory that negatively impacted profits. Our research and analysis conclude that we’re in the last round of inventory destocking for retailers, indicating that replenishment for peak season is around the corner. Trucking firms also noted lower retail inventories.

We’ve been on record that 2023 was going to be a tale of two halves, with the first half of the year trending down and the back half of the year trending up. We still stand by that. Q3 has been a bit slow out of the gates but we expect to see a better peak season than 2022.”

Drew Herpich

Chief Commercial Officer at TI & NTG

Key Learnings

Supply and demand drive the freight market. Consumers are still spending, but it is significantly less than during the pandemic. Carriers are exiting the market, although it is taking time to unwind from the surge of new entrants from prior years.

  • As a result of decreased demand when compared to 2021 and 2022, and an oversaturated carrier market, spot rates are currently at -9.9% YoY in Q3 2023 and are on their journey upward. To succeed in this environment, it is crucial to have visibility into internal and external datasets and conduct proper planning for when the market approaches inflationary territory.
  • Many carriers reached their operating cost floor and have left the market as a result, however given the sheer volume of carriers that entered the market in 2021 through 2022, it’s taking a while for enough capacity to attrit and align with the decreased demand when compared to that same period.
  • While spot rates are slowly on the rise and contract rates are following suit, we haven’t experienced a large capacity dislocation event to accelerate rate increases since the CVSA International Road Check and Memorial Day. Without any unexpected events, such as a hurricane, we believe that normal seasonality and capacity attrition will drive the freight market through Q3 2023 and into Q4 2023. This means that the freight market will be watching how peak season preparation and national holidays impact freight volume and rates.

Suggested Action

Here are our top 4 tips for shippers when preparing for Q4 2023 and 2024:

  1. Value service and reward loyal providers. Paper rates will turn on you.
    Once you convert a lane to contractual, honor that volume if the carrier is meeting service requirements. The carriers in your network will operate from two different vantage points, offering cheap rates that will be disposable later or approaching rate increase conversations early in hopes of securing the commitment long term. The direction you go will impact your stability as a shipper when the new cycle begins shifting in the carrier’s favor. If you currently have contracted carriers at good rates and service levels, our guidance is to see if you can extend those agreements into 2024.
  2. Take the time to assess your network and uncover opportunities. Act on the quick wins.
    This is a great time to conduct a supply chain analysis to understand your carrier base and your distribution network. Now is not the time to sit on your hands and ride the market without having a detailed understanding of your data and the health of your supply chain. Are you working with providers that are financially stable? Do you have the right mix of 3PLs, brokers, and assets? Are there opportunities to optimize and protect yourself from volatility in 2024? Uncover what you can do now to build resilience for the year ahead, and plan for the changes that will protect your supply chain long term.
  3. Find the right balance of spot and contract freight. There is still time if you act now.
    Last quarter we encouraged shippers to move as much volume as possible from the spot market to the contractual market over the next three months. There is still time to do this before contractual rates become inflationary YoY. Start with the 75% of your network that operates consistently or higher volume markets where you can find competitive contractual rates. With the freight that you do choose to leave on the spot market, make sure you don’t get caught flat-footed as rates increase.
  4. Continue to get comfortable with uncertainty. Be aware and stay agile in the 2024 planning process.
    We know the freight market operates in a cycle. Rates go up and rates go down. Carriers enter. Carriers exit. Demand increases. Demand decreases. However, there are periods when the fear of uncertainty, or prospective change, weighs heavily on supply and demand. We will feel this through the end of the year and into 2024 with inflation, fuel costs, increased payroll costs, and the Presidential Election Cycle Theory on the minds of shippers, consumers and carriers alike. While we are certain the freight cycle will turn, the speed at which it turns is always the question. As time passes, the reaction to these stressors and uncertainties will be a strong indicator of the velocity and magnitude we’ll see.

You have an opportunity to assess your current RFP strategy but need to move fast and get ahead of the new cycle. Remember contract lags spot by about 2-3 quarters. Those releasing RFPs in early 2024 may be at risk of higher contract rates due to spot rates being on the rise. The longer you wait, the more those increasing spot rates will impact contract pricing with carriers and 3PLs.”

Drew Herpich

Chief Commercial Officer at TI & NTG

Core Metrics

The Key Economic Indicators : The Cause (% YoY Change by Quarter)

The Key Economic Indicators : The Cause (% YoY Change by Quarter)

  • Consumption (PCE) for Q2 2023 reported at +2.3% YoY, holding steady after +2.4% reported in Q1 2023.
    • We are back to pre-2020 PCE range and against all other odds PCE continues to be resilient. This consumer resiliency reflects an optimistic side of the economy while inflation continues to be above the Fed’s target rate.
    • Non-durable goods reported +0.48% YoY consumption after a consecutive four quarters of negative readings.
    • Consumption for durable goods continues to move upwards from +2.6% in Q1 2023 to +3.4% in Q2 2023 YoY.
    • Services saw a slight reduction from +3.3% in Q1 2023 to +2.6% in Q2 2023 primarily due to continued inflation in the services sector.
  • Industrial Production (IP) fell further down to +0.02% in Q2 2023 against +0.9% in Q1 2023.
    • With sales reported to decline in the wholesale sector and inventory piling up, manufacturers continue to apply brakes on production.
    • If production continues to decline, it will fall below the X-axis.
      • In past years, an IP reading below the X-axis has coincided with an economic recession.
  • Imports continue to decline for the sixth consecutive quarter since Q1 2022 and went down further to -4.8% YoY.
    • The continued decline is after a record high level of imports in 2021 and first half of 2022, but it’s still higher than the pre-pandemic period.
    • U.S containerized imports in June 2023 were in tally with May 2023 but down 16.1% compared to June 2022, according to Descartes. We are optimistic that imports will come back for peak season.
  • Inventory to Sales ratio for May 2023 held steady at 1.40.
    • The % YoY change in this ratio for Q2 2023 is currently at +5.7%, which is lower than +6.3% reported in Q1 2023.
    • If consumption improves sales, and hence manufacturing, we may see demand picking up over the next few months and taking this ratio further down.

Freight Demand Metrics

Cass Freight Index : %YoY Change by Quarter

Cass Freight Index : %YoY Change by Quarter

Source: Cass Freight Index

  • Freight volumes represented by CASS Freight Index show the continued decline in demand for the third consecutive quarter.
    • With June 2023 readings, Q2 2023 reported at -3.7% YoY, which is also 5% lower than Q1 2023.
    • The index for June 2023 and Q2 2023 is at its lowest in the past 11 quarters, indicating freight demand is at the lowest point in over two years.

Freight Supply Metrics

New Authorities & Revocations (FMCSA)

New Authorities & Revocations (FMCSA)

Source:  Federal Motor Carrier Safety Administration (FMCSA)

  • Carrier revocations of operating authority continue to outpace new grants of authority for the past three quarters, indicating the continued exit of capacity in an oversupplied market.
    • While net revocations in June 2023 came in lower than May 2023’s figure, the reading is still higher than the new carrier authorities for June 2022.
    • This is the seventh net reduction in capacity over the last eight months since October 2022 (with a slight exception in April 2022).
  • Class 8 truck net orders in Q2 2023 reported negative % YoY growth for the second consecutive quarter.
    • In August 2023, FTR reported that truck order lead time fell to 5.8 months, which is the lowest it’s been in over two years.
    • Declining truck order lead time is a strong indicator of capacity exiting the market faster than capacity is willing to enter.

TL Spot & Contract Curve (% YoY Change by Quarter)

What is the Beon Band?

The Beon™ Band rolls up YoY quarterly averages of this data to create trend lines. This band is the outcome of the relationship between freight supply and freight demand, with freight demand being driven by the macroeconomic demand indicators. When we overlay the Beon™ Band with the demand curve in a single chart, we can see demand’s influence on the to-the-truck costs.

TL Spot & Contract Cost Curve : %YOY Change by Quarter

TL Spot & Contract Cost Curve : %YOY Change by Quarter


Analysis 360 | Checking the Record

What we got right in the previous outlook.

We project that the Beon Band will now move upwards towards the equilibrium from here with Q2 2023 around -22.5% and turn inflationary crossing the abscissa in the second half of Q4 2023.

  • From our analysis we were right on the mark with the YoY change in Q2 2023 Spot Rates ending at –24%. We are still projecting the Band to cross the abscissa in Q4 2023.

With net revocations of carrier authority running above 7,000 per month since October, we’re seeing capacity exit. We believe this trend will continue throughout this quarter and into the next.

  • Net revocations have held right around the 7,000 per month mark since we last reported on them. We expect this trend to continue throughout Q3 2023 and into Q4 2023 as well.

Where we were off the mark and why.

We expect the contract cycle to go further deflationary in Q2 and Q3 2023. It will likely start heading towards equilibrium in Q4 2023 and should cross the X-axis in Q2 2024. Contract cycle lags spot cycle by 2-3 quarters.

  • The deeper than expected drop in the spot rates in Q1 2023 caused a deeper than expected drop in the contractual market in Q2 2023. As a result, we have revised our projection for the YoY change in contractual rates to have already hit bottom. While rates will remain negative versus their yearly comparisons, we expect contractual rates to stay at the bottom in Q3 2023.

Rate Forecast

Spot: Rates are on the climb upward towards the abscissa. With an oversupplied market in a declining demand economy, capacity continues to exit the freight market. We expect Q3 2023 to average out to a -10% YoY change in spot rates when compared to 2022. Consumer demand will pick back up driven by peak season inventory stocking. As we enter Q4 2023, we will see YoY inflationary rates and predict that Q4 2023 will average a +10% YoY change in rates. 2024 will be a massive year for changes in spot rates. Our proprietary analysis forecasts spot rates in Q1 2024 will average out to +20% YoY.

Contract: Rates bottomed out in Q2 2023 at -13.9% YoY. We expect that Q3 2023 contract rates will continue to stay at the bottom around -12.5% YoY and start heading upwards with Q4 2023 rates projected at -5% YoY. We expect contract rates will enter inflationary territory in the back half of Q1 2024 and the average for the quarter will be -2.5% YoY. Contract curve lags the spot curve by approximately two quarters.

Q1 2023 was confirmed as the trough of the deflationary cycle, with cost to the truck moving upward since DOT week in May. Shippers should take the opportunity to review their transportation and procurement strategy through the remainder of the year as we project that the inflationary leg of the cycle will loom over the entirety of 2024. Striking a balance between cost and service, versus chasing cheap rates, will benefit you in the long term as capacity gets tighter and spot rates become more attractive than the contractual rates for carriers.”

Amit Prasad

Chief Data Science Officer at TI & NTG

Beon Band vs Economic Demand Indicators: % YoY Change by Quarter

Beon Band vs Economic Demand Indicators: % YoY Change by Quarter

Beon Band vs Freight Demand (CASS Freight Index) : %YoY Change by Quarter

Beon Band vs Freight Demand (CASS Freight Index) : %YoY Change by Quarter

Port to Porch Market Forecast

Inventories, Imports, & Peak Season

The National Retail Federation (NRF) Port Tracker notes that the prospects for a recession in the second half of 2023 are dimming and imports should increase. It expects monthly YoY declines in imports to decrease over the coming months, with imports showing growth in November 2023, which would be the first such reading in 18 months.

We are optimistic about a stronger than forecasted peak season, given the clear signs of growing tightness in the market and resolved disruption at the ports.

  • MoM imports from Asia bottomed out in March 2023 at 1.08 million TEUs and steadily climbed to 1.42 million TEUs in June 2023.
  • FEU (Forty-Foot Equivalent Units) container spot rates from Asia to the West Coast jumped 70% since June 2023.
  • The strike at the US West Coast ports was alleviated in June 2023 when a tentative agreement between the union and the Pacific Maritime Association (PMA) was reached.

It is important to note, it will be several months before the contract is ratified by union members and even longer for volumes to return to those ports. Many shippers diverted volumes to East and Gulf Coast ports to avoid potential disruption.

Truckload

Truckload carriers are exiting the market; most notably smaller carriers. For reference:

  • In the first six months of 2022, over 47,000 drivers at carriers with less than five trucks, lost operating authority.
  • In the first six months of 2023, over 71,000 drivers at carriers with less than five trucks, were no longer operating.

This is a 51% jump in driver attrition, which is hardly surprising given the surge in capacity that entered during the COVID-era is no longer able to profit at current demand levels. On top of that, over the past two years, larger assets keep getting bigger as smaller players get smaller. For reference, FTR reported:

  • 1-5 truck firms lost nearly 10% of their capacity between July 2022 to June 2023.
  • 100+ truck firms experienced a 2.5% gain in available capacity.

Given market dynamics, this is not out of the norm and is what should be expected during a protracted market downturn. The larger carriers will try to take advantage of their expansion and strategically “park” surplus trucks and force the market to react. As rates begin to increase, drivers will be assigned to those seats and operate over the road. Eventually, we will see a dance between assets and their drivers, with some drivers opting to leave the asset and run as an owner-operator in favor of chasing higher rates in the spot market.

Less-Than-Truckload

Our analysis of Yellow’s exit from the industry suggests an immediate short-term impact on LTL pricing, but a low to moderate long-term impact.

  • Our analysis shows that there is a sufficient buffer in labor capacity and productivity across existing LTL providers in the current market. These providers can absorb the YRC volume, which represents roughly 10% of the total LTL market, leading us to believe there is insignificant impact to be expected long term.
  • Growth for the LTL freight market has been declining over the past 12 months due to oversupplied capacity in a declining demand economy. This disruption should help LTL growth rebound and move upwards again.

Parcel

UPS and the Teamsters reached a tentative agreement in July 2023 and Union members will vote on the agreement during August 2023. If ratified, it will mean higher costs for UPS and will result in another record-breaking rate increase for 2024.  We anticipate 6.9% increases on transportation and double digit increases on many surcharges and fees.  We anticipate other carriers will take advantage and follow suit with rate increases in 2024. UPS will begin fighting to win lost customers, but we expect them to be selective in this pursuit.

Demand surcharges are expected to be announced in Q3 2023 with peak season returning to its normal, pre-pandemic period of November – December. However, retailers are mitigating last mile delivery costs by encouraging “buy online, pick up in store,” or BOPIS. Retailers such as Target, Walmart and Amazon are expanding their own last mile delivery services and we expect the USPS to compete more aggressively for ecommerce customers by pushing their new Ground Advantage service.

Cross-Border

Geopolitical risks are driving nearshoring opportunities to Mexico. “If US manufacturing is to be less dependent on China, we think the path will be via Mexico,” says Morgan Stanley Research equity analyst Nikolaj Lippmann. According to the consulting firm, nearshoring has the potential to boost growth of Mexican manufacturing exports to the US, from $455 billion today to an estimated $609 billion in the next five years.

Recent Posts

STAY INFORMED AND UP TO DATE WITH THE LATEST DRAYAGE NEWS
dry van shipping
WHAT IS BILL OF LADING?
Q1 2024 TRANSPORTATION OUTLOOK

5 THINGS I WISH SOMEONE TOLD ME BEFORE I BECAME A C-SUITE EXECUTIVE

Back to Resources

Aug 02, 2023

5 Things I Wish Someone Told Me Before I Became a C-Suite Executive

News

Our CCO, Drew Herpich, recently sat down for an interview with a representative of Authority Magazine to talk about his career growth and how he got to where he is today. Read the full interview below:

Thank you so much for joining us in this interview series. Before we dive into our discussion, our readers would love to “get to know you” a bit better. Can you share with us the backstory about what brought you to your specific career path?

My first job after college was with a brand-new company based in Chicago. My cousin has told me about this guy, Jeff Silver who led a company called American Backhaulers. That company ended up being sold to C.H. Robinson, but he had just launched a new company called Coyote Logistics. It ended up being the best move for my career. I spent 14 years at Coyote before eventually making the decision to switch companies. Walking away from that job was one of the hardest decisions I’ve ever had to make, and it taught me a lot about myself and people in general. When I finally made the decision, I realized how many people have an opinion, and for better or worse, it helped me find out who my true friends and colleagues were.

Can you share the most interesting story that happened to you since you started your career?

My first year at Coyote was a phenomenal time, even if we spent every single day wondering when we’d go out of business! Fast forward 14 years and UPS bought Coyote for $1.8 billion. Watching the company grow from 15 people to more than 3,300, to then being sold to one of the largest companies in the world was the most incredible thing I’ve ever been a part of. I started as a freight broker and left managing a group of more than 600 reps. We grew so fast and I was able to see everything as I worked my way up.

Can you please give us your favorite “Life Lesson Quote”? Do you have a story about how that was relevant in your life?

My executive coach, Hal Runkel, and I talk a lot about: “If you want to do something, you’ll do it.” I think about this a lot — in business and in my personal life. So many times — whether it’s an event on the weekend, or a trip you’re supposed to take, or a meeting you’re supposed to be at — we make excuses instead of doing the thing. Like anything in life, if you really want to do something, you will. My dad has been retired now for eight years. We always talk about doing things together and when something comes up, I remind him of this quote.

Is there a particular book that made a significant impact on your leadership style? Can you share a story or an example of that?

There are two books actually! One was recommended to me from our CEO, Ken Beyer, when he came on board three years ago. It’s called “Good to Great” by Jim Collins. It’s about working through the journey to leadership and understanding what true, effective leadership looks like.

The other book is “The Intelligent Investor” by Benjamin Graham, Warren Buffett’s mentor. Both books demonstrate the precision it takes to be at the top of your game — whether it’s investing or leadership — and how to get there. They both taught me patience. Being great at something will take time — learning, adopting, trying things you normally don’t do. How you incorporate that in your business and life is important.

What do you think makes your company stand out? Can you share a story?

When I was making the decision to come to Nolan Transportation Group (NTG), I vividly remember a phone call I had with Kevin Nolan, our founder. He told me, “I’ve got this brokerage company to where it is today but to get it to $5 billion or a top five broker, I need help and expertise.” I knew right then that if the founder had this aspiration, the rest of the company would as well. My gut feeling paid off.

Today, Transportation Insight Holding Company (TIHC), a combination of Transportation Insight (TI) and NTG, brings people and technology together to make world-class logistics accessible to any business. We have a network of over 2,500 logistics experts in 13 offices who play matchmaker for our 15,000 shippers and 80,000 carriers nationwide. Our newest tool is like a dating app but instead of pairing people, we’re connecting trucks and cargo freight.

You are a successful business leader. Which three character traits do you think were most instrumental to your success? Can you please share a story or example for each?

The biggest one for me is empathy and just understanding where people come from. I pride myself on the fact that, in this industry, I’ve done literally every part of the job. Everything from working with carriers to customers, running multiple different departments, pricing the freight, managing people on the road… you name it, I’ve done it. You don’t need to have done every job, but it definitely helped me when I first started as a leader. I don’t think you can truly be a good leader without empathy.

Another character trait that’s been instrumental to my success is radical transparency. There’s being transparent and then there’s being radically transparent, which for me, means an almost over-the-top approach to telling the truth — like telling people the things they probably don’t want to hear, or the things that most people won’t tell them.

Every single day I’m thinking about leadership — what makes a good leader, what skills I need to work on — and every call I get on I think about how I’ll add value. How will I add value to that customer, that leader, that individual rep, that other department I don’t talk to on a daily basis. Finding your value add, no matter the situation, makes others remember and want to work with you.

Leadership often entails making difficult decisions or hard choices between two apparently good paths. Can you share a story with us about a hard decision or choice you had to make as a leader?

The hardest decisions are when you’ve put a lot of effort and time into someone and the time comes where that individual is no longer needed at the company. It’s one of the hardest decisions to make, because you’ve invested in that person, you’ve believed in that person. You have a relationship with that person. You understand their family and their kids and what they go through on a day-to-day basis. Having to make hard decisions from that is really difficult, but knowing it’s the right outcome for the 2,000 other people in the organization helps give me clarity.

Ok, thank you for that. Let’s now jump to the primary focus of our interview. Most of our readers — in fact, most people — think they have a pretty good idea of what a C-Suite executive does. But in just a few words can you explain what a C-Level executive does that is different from the responsibilities of other leaders?

It’s all about vision and impact. In my job, I need to evaluate how every decision we make affects our customers and their customers and so on. That’s my number one priority. From there, it’s thinking about how changes may affect us here at TIHC and the industry on a macro level. I’m also constantly thinking about the culture of our two companies, Transportation Insight and Nolan Transportation Group, and how to forge the most mutually beneficial path for each brand. C-Level executives must lead with decisiveness, and ultimately, bear responsibility for a company’s performance and success.

What are the “myths” that you would like to dispel about being a C-Suite executive? Can you explain what you mean?

At the end of the day, I go home and put basketball shorts and a t-shirt on. Yes, C-suite execs are very competitive people who want the best for their company. But that also means they want the best for their home life too. For me that’s getting out of my slacks, putting on basketball shorts and spending time with my friends and family. We all need to take a break from the spreadsheet and do something completely different. For me, that’s being with my wife and two-year-old son.

What are the most common leadership mistakes you have seen C-Suite leaders make when they start leading a new team? What can be done to avoid those errors?

Failing to establish clear and open lines of communication. Communication is one of my non-negotiables — if you can’t communicate effectively and directly, it probably isn’t going to work. I’m clear about this from day one, which helps set expectations from the get-go.

Like communication, being open to feedback is critical. Good ideas can come from anywhere and someone’s title on their business card should be irrelevant if they have a valid point. C-suite leaders need to lead by example to create a culture of continuous feedback, from the top down.

Another mistake is not trusting your team. You’ve hired these people for a reason, so you need to trust them. Don’t micromanage them. Provide guidance and support when necessary, but trust your team to deliver results.

In your experience, which aspect of running a company tends to be most underestimated? Can you explain or give an example?

Being adaptable. Whether it’s adapting to new tech, market trends or customer feedback. Leaders need to be seeking feedback proactively, too, and be willing to embrace innovation. I’m proud of how we’ve done this at TIHC. We not only anticipated the digital transformation of our industry but we’re leading the charge in developing new tech and tools for our customers. Navigating change isn’t easy. To be successful, you need to plan, communicate, communicate again and have an open mind.

Nolan transportation speaking engagement

Ok super. Here is the main question of our interview. What are your “Five Things You Need To Be A Highly Effective C-Suite Executive”?

1. The ability to see into the future — or at least to think about it.

2. Care about others and putting your company above yourself.

3. Communicate effectively from the top down — whether it’s the board, other leadership or the person that just started.

4. Understand your industry. Too many times I’ve seen people go from C-level job to C-level job, not understanding the intricacies of the market or what they’re doing. You need to not only know your employees and your business but also your industry. Know who you’re competing against and what those strategies should look like.

5. Know when to take a step back. I guarantee most C-level executives are doing the first four things. But most importantly, you need to know when to take a step back and realize that life isn’t just your business or the company you’re working for. You need downtime to be successful. You need to have a clear head and if all you’re doing is focusing on work, it’ll eventually get clouded.

In your opinion, what are a few ways that executives can help to create a fantastic work culture? Can you share a story or an example?

One thing I still do — and always will — is work with everyone. You’ll hear people say, “my door is open, or come on in”, but I don’t have an office on purpose. I move around just like everybody else. Being part of the collective helps everyone remember I’m accessible, open and working toward the same goal they are.

Another thing is to always be selling. No matter if today is your first day or you’re the CEO. You need to be selling — to customers, employees, investors, and the industry. You’re always selling yourself and your company and your brand every single day.

You are a person of great influence. If you could start a movement that would bring the most amount of good to the most amount of people, what would that be? You never know what your idea can trigger. 🙂

The more you can understand that we’re all the same, living in the same world, doing the same things, the better off we’ll all be.

So many people think people are different, whether it’s because of hierarchy at work or how much money you have or your seat on the plane. I always say to people, when you go out to dinner and you see how a person treats a waitress or waiter, you’ll find out quickly if that person is a good person or not.

How can our readers further follow you online?

I’m on LinkedIn at https://www.linkedin.com/in/andrewherpich/ and you can follow TIHC at @TransprtInsight on Twitter and https://www.linkedin.com/company/transportation-insight.

Thank you for the time you spent sharing these fantastic insights. We wish you only continued success in your great work!

Recent Posts

STAY INFORMED AND UP TO DATE WITH THE LATEST DRAYAGE NEWS
dry van shipping
WHAT IS BILL OF LADING?
Q1 2024 TRANSPORTATION OUTLOOK

TRANSPORTATION INSIGHT AND NOLAN TRANSPORTATION GROUP HOST ATLANTA RIVER CLEANUP WITH CHATTAHOOHEE RIVERKEEPER

Back to Resources

Jun 02, 2023

Transportation Insight and Nolan Transportation Group host Atlanta river cleanup with Chattahoochee Riverkeeper

News

Local logistics provider demonstrates commitment to giving back with series of tree planting and river cleanups

Atlanta – May 31, 2023, Transportation Insight (TI) and Nolan Transportation Group (NTG), a leading provider of non-asset, tech-enabled logistics and brokerage solutions in North America, will collaborate with Chattahoochee Riverkeeper (CRK) to remove trash in and around the Chattahoochee River watershed on June 3 at Atlanta Memorial Park. This marks the second consecutive year TI & NTG participate in a river cleanup event with CRK.

TI & NTG partnered with environmental groups across the country to engage local offices in tree planting and river cleanup projects. These partnerships aimed to give back to the communities in which employees live and work and to date, 163 TI & NTG employees have planted almost 300 trees and donated $47,500. TI & NTG will also remove approximately 2,000 lbs. of debris from local waters through multiple river cleanup events.

TI & NTG environmental partners:

Atlanta, GA – Chattahoochee Riverkeeper

Austin, TX – TreeFolks

Charleston – Charleston Parks Conservancy

Charlotte, NC – TreesCharlotte

Chicago, IL – Chicago Region Trees Initiative

Dallas, TX – Texas Trees Foundation

Denver, CO – The Park People

Detroit, MI – Releaf Michigan

Grand Rapids, MI – One Tree Planted

Hattiesburg, MS. – The Nature Conservancy

Hickory, NC – Catawba Riverkeeper

Nashville, TN – Cumberland River Compact

“The Chattahoochee Riverkeeper cleanup marks our twelfth environmental project across the US this year,” said Ken Beyer, CEO of TI & NTG. “Atlanta is the home to our headquarters and is the perfect place to celebrate our commitment to sustainability and the communities we live, work and play.” 

“Chattahoochee Riverkeeper’s treasured partnership with TI & NTG has supported our vision of a Trash-Free Chattahoochee, says Juliet Cohen, executive director of Chattahoochee Riverkeeper. “Since 2021, TI & NTG volunteers have removed more than 1,500 pounds of trash, tires, and recyclables from the waterways of the Chattahoochee. Not only do they show up with a strong volunteer force, but they also back their support with vital funding to help sustain our programs. We look forward to growing and collaborating with TI & NTG in the future.”

About Transportation Insight Holding Company:

TIHC is a combination of Transportation Insight (TI) and Nolan Transportation Group (NTG) and brings people and technology together to make world-class logistics accessible to any business. Together with the support of 2,500 nationwide experts, our highly intelligent, intuitive platform gathers 80,000 carriers to bring on-demand logistics and the capacity to scale as needed, when needed. Whether outsourcing their entire logistics operation to us, booking a single load, or something in between, more than 15,000 shippers trust TIHC to successfully guide their products from port to porch. To learn more about Transportation Insight and Nolan Transportation Group, visit www.transportationinsight.com and www.ntgfreight.com.

Ryan Rogers

Director, Corporate Communications

[email protected]

(770) 373-0480

Recent Posts

STAY INFORMED AND UP TO DATE WITH THE LATEST DRAYAGE NEWS
dry van shipping
WHAT IS BILL OF LADING?
Q1 2024 TRANSPORTATION OUTLOOK

Q2 TRANSPORTATION OUTLOOK 2023

Back to Resources

May 08, 2023

Q2 Transportation Outlook 2023

News

Prepare now or lose later

Table of Contents:


The wait continues from Q1 into Q2 2023 for any meaningful pickup in imports as shippers work down existing inventory levels and U.S. manufacturing activity contracts. Inflation is slowly easing and while retail sales show that they decreased 1% from February into March 2023, they are, in fact, still up 3.1% YoY, when we exclude sales at gasoline stations.

On the capacity front, carriers are struggling with the slowdown in demand, increased competition on available freight and spot rates that remain bottomed out since Q1 2023. On the upside, market indicators are pointing to a stronger second half of the year.

Let’s all remember, our freight industry is very cyclical. We believe we are at the bottom now, but when will the market turn?

If shippers are not focused on contingency planning for Q4 2023 and early 2024, they will run the risk of higher costs, lower service quality and inevitable delivery delays later in the year. In this outlook, we will give you the data and perspective needed to navigate the current quarter and plan for the back half of 2023 and early 2024.


TL Market Fundamentals

Rates will continue to be in shippers’ favor through Q2 2023, but now is not the time to sit back. It’s time to work in tandem with your 3PL and carrier partners to discuss and plan for the second half of the year.

  • Shippers expect slower sales for the first half of 2023. They will be more cautious in replenishing inventories as they continue to wind down last year’s inventory surplus, which was the highest YoY comparison at +11.4% in Q3 2022. 
  • Consumers are still spending as inflation remains high, up 5.0% YoY at the end of Q1 2023. As consumers are more careful with their spending, and larger portions of consumers’ paychecks are going toward essentials such as food, consumers continue to prioritize service purchases over goods purchases.
  • Retail sales ended Q1 2023 down 1.0% from February into March, however yearly comparisons place retail sales up nearly 3% YoY. Many consumers are utilizing credit to continue their spending habits, returning credit card debt to record-high levels which are currently up 16.5% above February 2022 levels. Interest rates are also not helping the consumers, placing even more of a burden on those with high credit card debt. As a result, there is a growing concern that consumers will be unable to maintain the same level of consumer spending in the second half of 2023.  

Analysis 360 | Checking the Record

What we got right in our previous outlook.

Q1 2023 contract rates are dipping into deflationary territory YoY and will likely remain deflationary throughout 2023 and into Q1 2024.

  • The contract TL market for Q4 2022 ended at +1.8%. We expected this contract curve to enter the deflationary cycle in Q1 2023 at -2.5% YoY and continue to stay deflationary for the entirety of 2023. 

Where we were off the mark, and why

Rates will continue to trend downwards, reaching the bottom by the end of Q1 2023 when operating costs outweigh profit, causing more carriers to exit the market. Starting around Q2 2023, expect a sharper than usual bounce back from the bottom of the cycle in reaction to the rapid drop in prior quarters.

  • The Beon™ Band* for Q4 2022 ended at -34.9% due to weaker-than-expected peak demand. We believed Q4 was going to be the bottom of the freight rate cycle, and from there we expected our journey upward to equilibrium, and crossing the x-axis in Q3 2023.
  • As a result of capacity hanging around longer than anticipated despite the low spot rates, in addition to the low demand, the bottom of the freight cycle occurred in Q1 2023 at -35.4%. 

Key Learnings

With supply surpassing demand, shippers must take advantage of this time to prepare contingency plans for unknown risks through the end of 2023.

  • As a result of decreased demand and an oversaturated carrier market, as of May 2023 spot rates are currently at -26.8% YoY and have just started their journey upward, yet inflation remains well above the Fed’s target of 2%. To succeed in this environment, it is crucial to have visibility into internal and external datasets and conduct proper planning for when the market approaches inflationary territory.
  • The spikes in the market are becoming more dramatic since the pandemic, with the last bottom of the cycle around -20% YoY versus 2023 at -35.5%. Carriers have floors to their pricing relative to their operating costs, typically in the $1.65 to $1.70 CPM range (excl. fuel), which means we can normally anticipate when supply will have to exit. However, because of the decreasing fuel costs and lack of opportunity to switch to another craft, drivers are holding out longer this time around.
  • For any material change in spot rates to occur, there needs to be a capacity dislocation event, or catalyst. The question remains, will it be increased demand or capacity attrition? As it stands right now, it appears that demand will only get a modest gain from Produce Season, thus the catalyst will most likely be enough attrition of capacity to cause a steeper increase in spot rates. With net revocations of Carrier Authority running above 7,000 per month since October, we’re seeing capacity exit. We believe this trend will continue throughout this quarter and into next. 

Here are our top 3 tips for shippers when preparing for the second half of 2023: 

  • Live up to your commitments.  Once a lane is converted to contractual, honor that volume commitment if meeting service requirements and avoid the temptation of a slightly better spot price. While spot is attractive at the current rates, you will open yourself up to more risk onboarding a poor service provider taking advantage of current market conditions. 
  • Move as much volume as possible from the spot market to the contractual market over the next 3 months. When doing this, focus on your higher volume lanes (over 52 loads per year) or on higher volume markets where you could find competitive contractual rates.
  • Benchmark carrier service metrics, such as tender acceptance % and on-time pickup/delivery, so you can hold them accountable to the same performance levels in the second half of 2023 and beyond. This is crucial as we head into 2024 with rates expected to be in the carrier’s favor again. 

Q2 2023 is not a period to sit on your hands. Instead, it’s time to work in tandem with your 3PL and carrier partners to discuss what the second half of the year will look like and plan accordingly. We all know rate volatility is real…and it’s about to get even more real when the market does flip. Don’t wait to act until it’s too late.”

Drew Herpich

Chief Commercial Officer

Email Drew Herpich, Chief Commercial Officer and Amit Prasad, Chief Data Science Officer directly with questions at [email protected]

CLICK HERE


Core Metrics

Key Economic Indicators : The Cause (% YoY Change by Quarter)

Key Economic Indicators : The Cause (% YoY Change by Quarter)

  • Preliminary readings for the Personal Consumption Expenditures (PCE) for Q1 2023 show a +2.3% YoY, which is stronger than expected. This marks the first improvement in consumption after six quarters of sequential decline.
    • Durable goods consumption bounced back to +2.7% YoY. Non-durable goods also changed relatively high to -0.3% YoY. 
    • Services held flat at +3.0% YoY. This shows a shift in consumption dollars from goods to services sector. 
    • The PCE Price Index shows the prices for service stayed inflated in Q1 while for the durable and non-durable goods cooled down.  
  • Industrial Production (IP) went down to +1.0% in Q1 2023 as expected. Manufacturing output decreased 0.5% in March and was 1.1% below its year-earlier level. 
  • Inventory-to-sales ratio decreased to +5.7% in Q1 2023, which is in line with PCE readings. 
  • Inflation numbers show further signs of cooling.
    • CPI Inflation for March 2023 came down to 5% month-to-month, but inflation is still positive at +0.1%.  
  • Imports were on course-correction much of last year.
    • Imports went further down to -2% YoY in Q1 2023.
      • Changes up or down in imports influence the freight demand since the raw material, intermediary or finished products imported from outside will likely ship at some point on a truck to reach its destination. 
      • Like IP, imports down below the X-axis in the past have coincided with an economic recession. 


According to Wolfe Research’s Q1 2023 shippers’ survey, about 41% of shippers cited higher year-over-year inventory levels. Despite progress in reducing inventories, 55% of shippers noted that their inventory levels are still above targeted levels, the highest level in 11 quarters. Thus, inventory de-stocking headwinds to freight volumes seem likely to continue in Q2 2023.


TL Spot & Contract Cost Curve (% YoY Change by Quarter) 

TL Spot & Contract Cost Curve (% YoY Change by Quarter) 

What is Beon™ Band?

The Beon™ Band rolls up YoY quarterly averages of this data to create trend lines. This band is the outcome of the relationship between freight supply and freight demand, with freight demand being driven by the macroeconomic demand indicators. When we overlay the Beon™ Band with the demand curve in a single chart, we can see demand’s influence on the to-the-truck costs.


Rate Forecast 

  • TL spot & contract with Beon™ Band  
  • Spot: Lower-than-projected freight demand due to softer economy and plummeted imports in Q1 2023 took the Beon Band further down to -35.5%, making it the new bottom of the deflationary leg. We project that the curve will now move upwards towards the equilibrium from here with Q2 2023 around -22.5% and turn inflationary crossing the abscissa in the 2nd half of Q4 2023. We expect that it will stay inflationary for the entirety of 2024 reaching the peak of inflation in Q4 2024.
  • Contract: The TL contract cycle (represented by change in CASS TL Index) shows the contract TL cycle finally entered the deflationary leg in Q1 2023 at -7.1% YoY, close to our forecast of -7.5%. We expect the contract cycle to go further deflationary in Q2 and Q3 2023. It will likely start heading towards equilibrium in Q4 2023 and should cross the X-axis in Q2 of 2024. Contract cycle lags spot cycle by 2-3 quarters. 

As shippers navigate the deflationary market, this is the time to strengthen relationships with loyal carriers. As the supply further exits, the spot market is going to tighten towards the year-end and into 2024, and the tender rejections are going to increase. Building a long-term transportation and procurement strategy is going to help navigate through the inflationary leg of the cycle.”

Amit Prasad

Chief Data Science Officer

Port to Porch Market Forecast

Drayage 

Lackluster imports will continue through this quarter as shippers focus on shipment accuracy and carriers adjust to volume challenges. 

  • Shipper KPIs drastically shifted compared to Q2 2022, when the main concern was available capacity and tender acceptance. As of late, shippers are less focused on capacity and more focused on invoicing speed, accuracy, carrier accessorial scrutiny and visibility. 
  • Labor tensions on the West Coast are steering shippers to the East and Gulf Coasts, such as NY/NJ, Savannah, and Houston. Descartes Systems Group recently claimed that over 1 million TEUs per year have shifted away from West Coast ports because of the labor tensions and service concerns. 
  • Total U.S. Port TEUs are down YoY, but we have seen a 6.9% increase in volume from February into March 2023.
    • Two points of considerations:
      • March 2023 had 3 more shipping days than February 2023. 
      • Chinese New Year started in January 2023 and could have caused import carryover into March 2023.

LTL

This quarter, shippers need to re-evaluate their carrier usage as carriers’ pricing discipline has allowed rates to hold above standard.  

  • Many shippers still think LTL carriers should be dropping prices to gain more volume. The reality is some carriers are making small adjustments in order to prioritize more attractive freight (standard-size pallets, business-to-business).   
  • Shippers need to work closely with key incumbents during rate negotiations and service-level reviews to create win-win results.
    • Explore volume quotes for larger shipments. Most carriers are providing re-quotes in the majority of lanes again. 

Parcel

Rate increases are no longer sustainable; now is the time to be more open to negotiating and diversifying the carrier base as capacity softens. 

  • The average rate increase for FedEx and UPS was 6.9% compared to 5.9% in 2022.  
  • UPS Teamster contract expires July 31, 2023, as national negotiations began in April 2023.
    • Shippers are moving volumes away from UPS to mitigate the risk of a potential strike.  
    • Startups and regional carriers doubled their collective package volume in 2021 and witnessed an additional 25% growth in 2022, according to the Pitney Bowes Parcel Shipping Index. 

Cross-Border

Demand for cross-border services between U.S. and Mexico remains strong for the second quarter of 2023 as U.S. and Canada volumes remain low. 

Canada 

  • February freight volume between the U.S. and Canada is up 5.5% YoY. The truckload freight is valued at $32.8bn, according to the Bureau of Transportation Statistics. 
  • Capacity outbound from Canada, especially out of major metros, remains very strong and up more than 4% YoY according to Census data.
    • Carriers are looking for consistent opportunities to get them on the U.S. side of the border because of the relatively stronger demand for U.S. imports into Canada. 

Mexico 

  • February freight volume between the U.S. and Mexico is up 7.8% YoY. The truckload freight is valued at $43.1bn, according to the Bureau of Transportation Statistics. 
  • Trade between the U.S. and Mexico continues to grow, increasing by 10% in the first two months of 2023 compared to the same period in 2022.  
  • Mexico was ranked number 1 among U.S. trade partners during the first two months of 2023, showing demand for cross-border transportation services will continue on both sides of the border. 

If you have questions or would like to talk to Drew Herpich, Chief Commercial Officer and Amit Prasad, Chief Data Science Officer then please reach out to them directly at [email protected]

Recent Posts

STAY INFORMED AND UP TO DATE WITH THE LATEST DRAYAGE NEWS
dry van shipping
WHAT IS BILL OF LADING?
Q1 2024 TRANSPORTATION OUTLOOK